Discotope Dataset - 25 Families, 75 Protein Chains
Average Family ROC Area Under the Curve: 0.753810253333
Average Family Precision-Recall Equal Point: 0.259761993333
Average Family Average Precision: 0.30069228
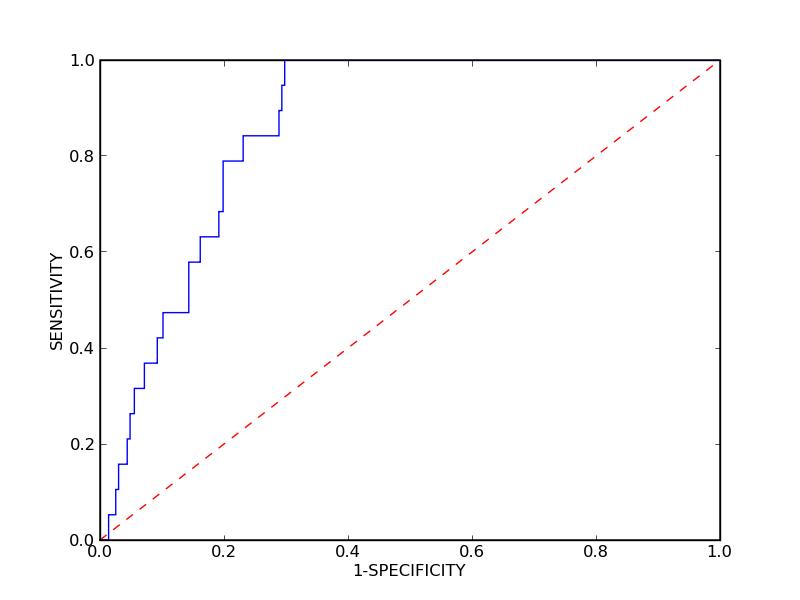
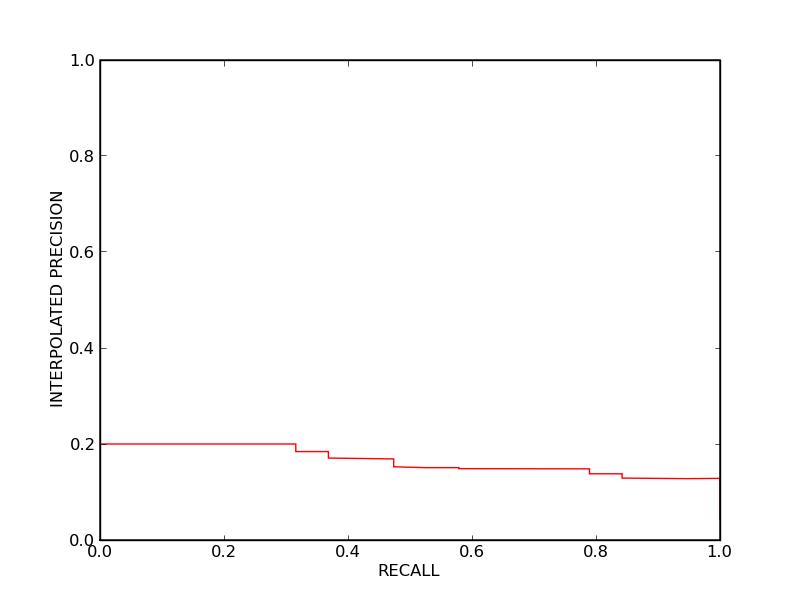
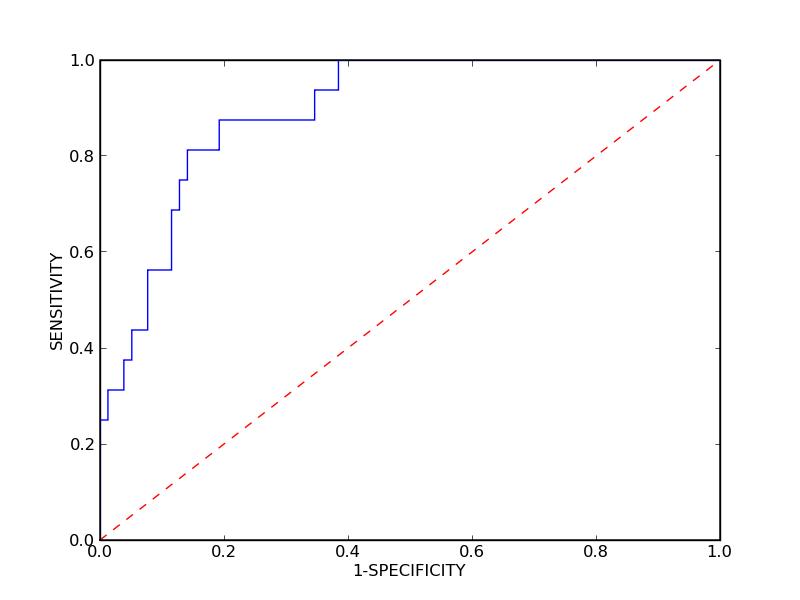
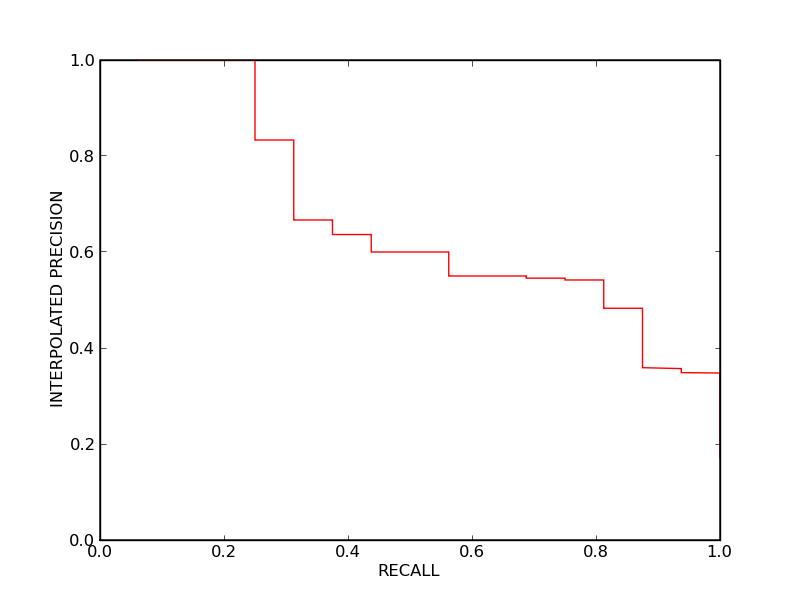
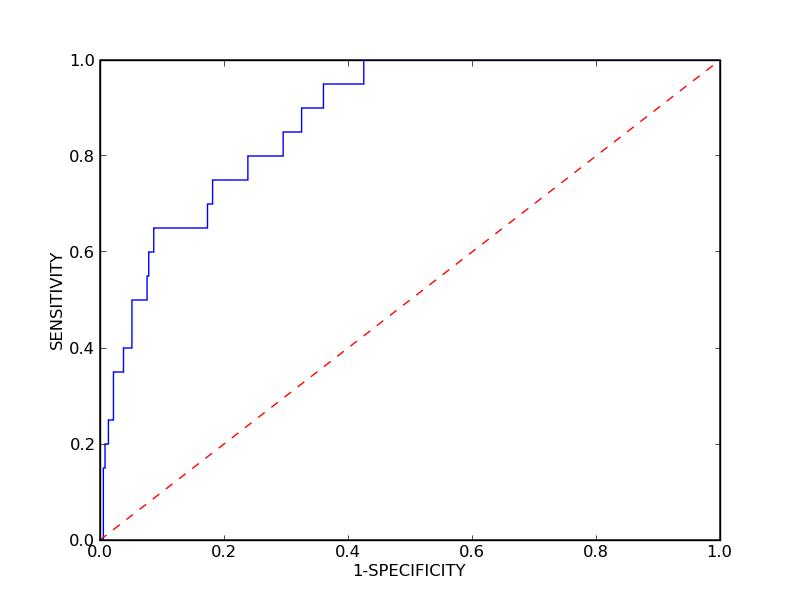
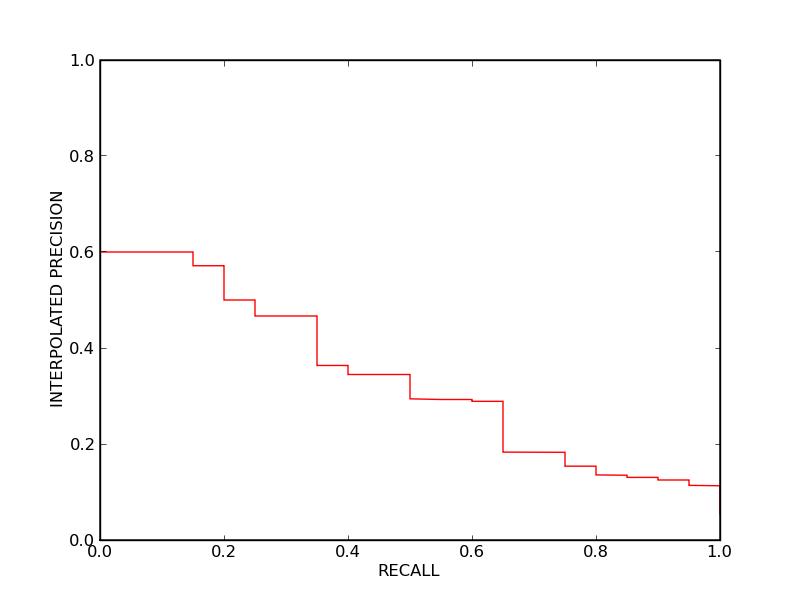
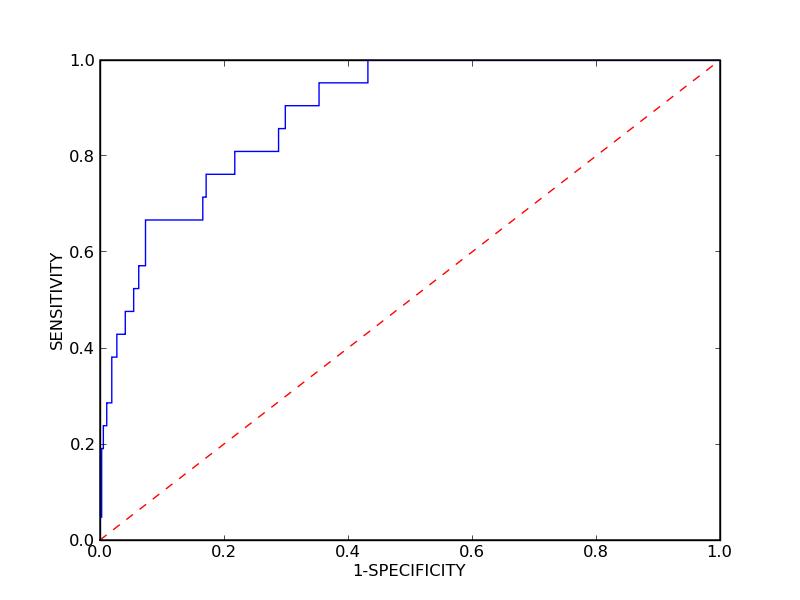
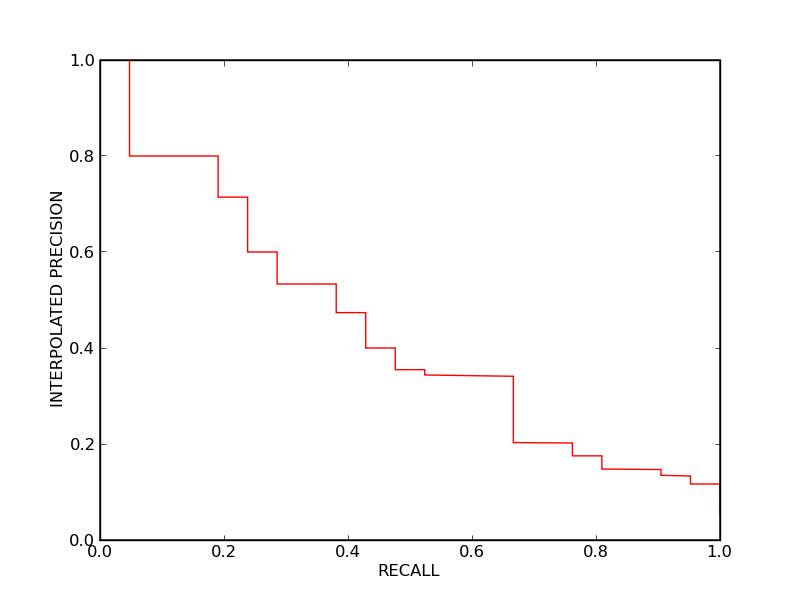
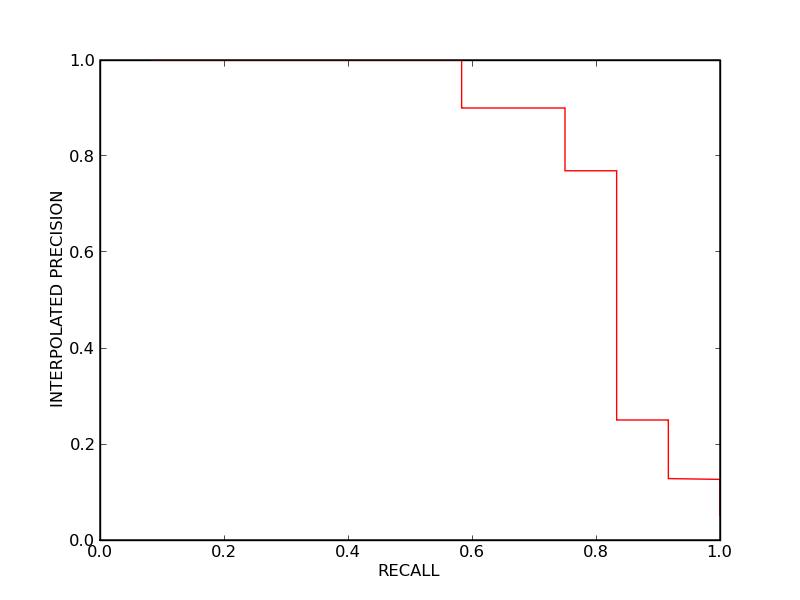
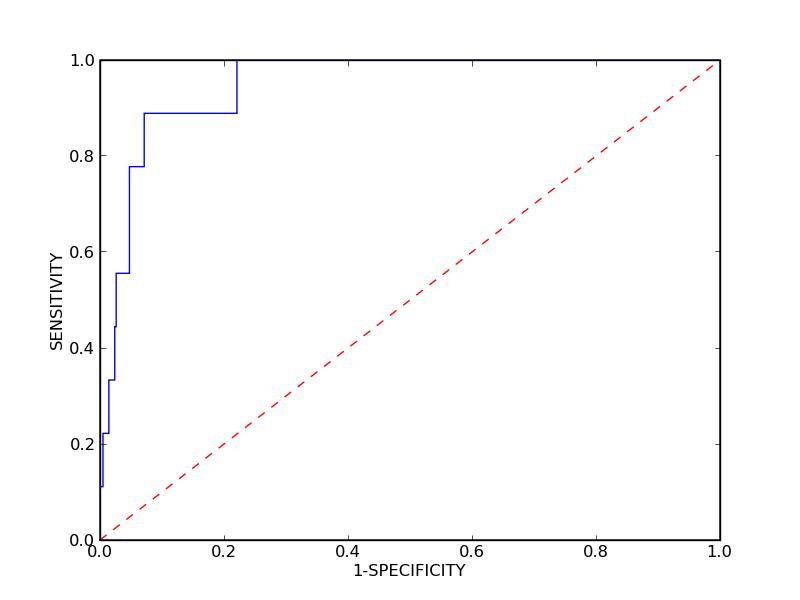
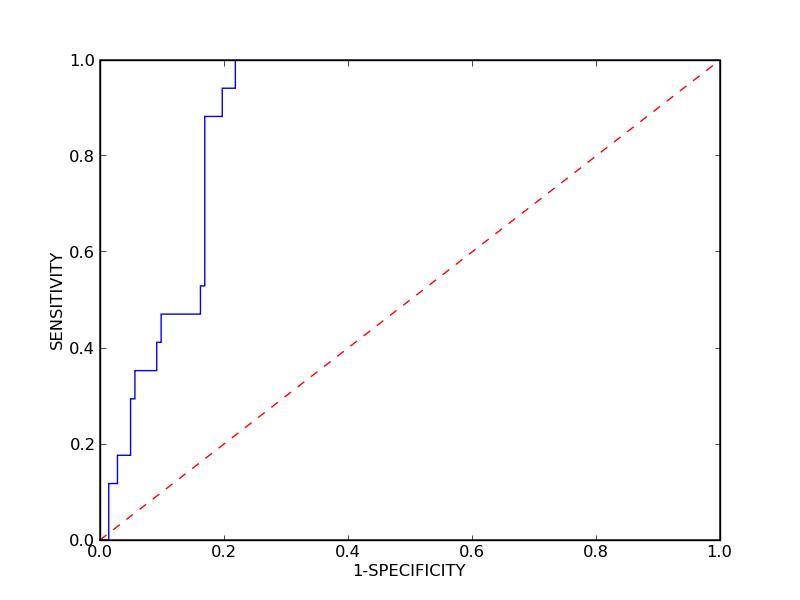
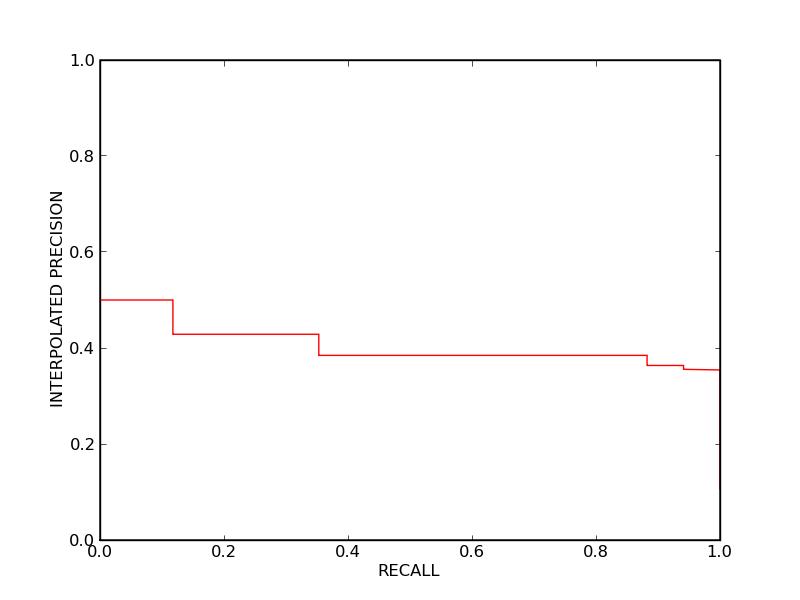
Protein Family IDs: 1xiwA
ROC Area Under the Curve (Family Average): 0.89587
Precision-Recall Equal Point (Family Average): 0.58824
Average Precision (Family Average): 0.61554
ROC Area Under the Curve (Family Average): 0.89587
Precision-Recall Equal Point (Family Average): 0.58824
Average Precision (Family Average): 0.61554
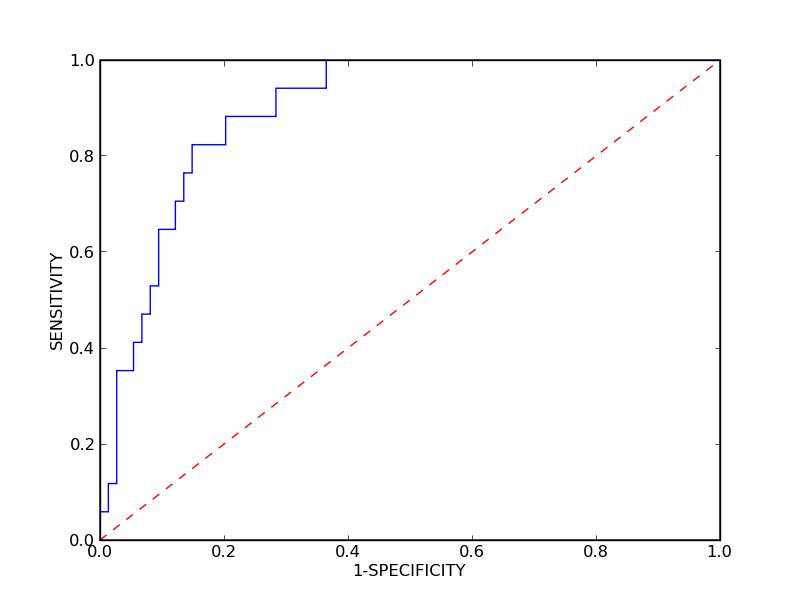
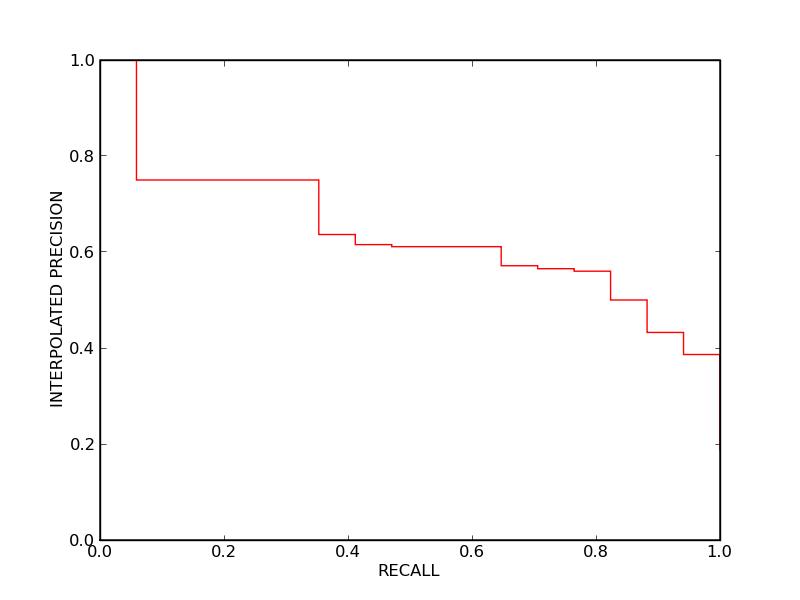
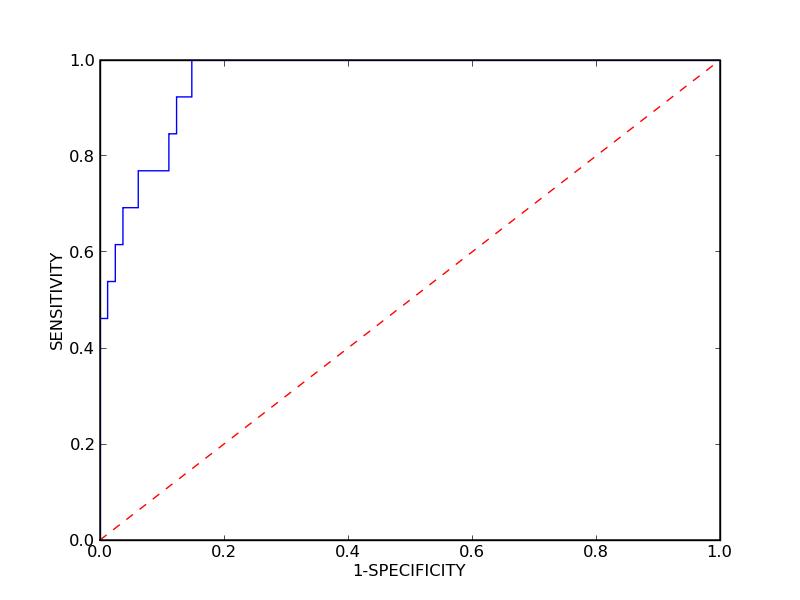
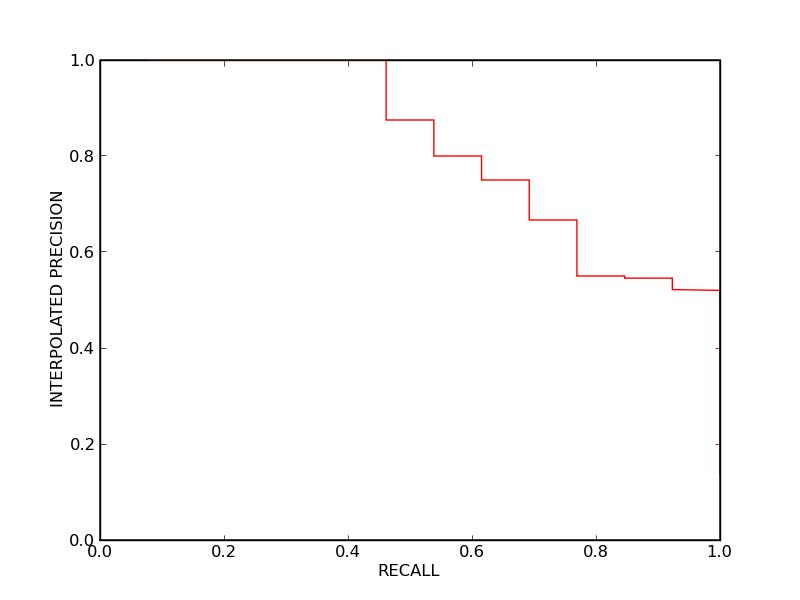
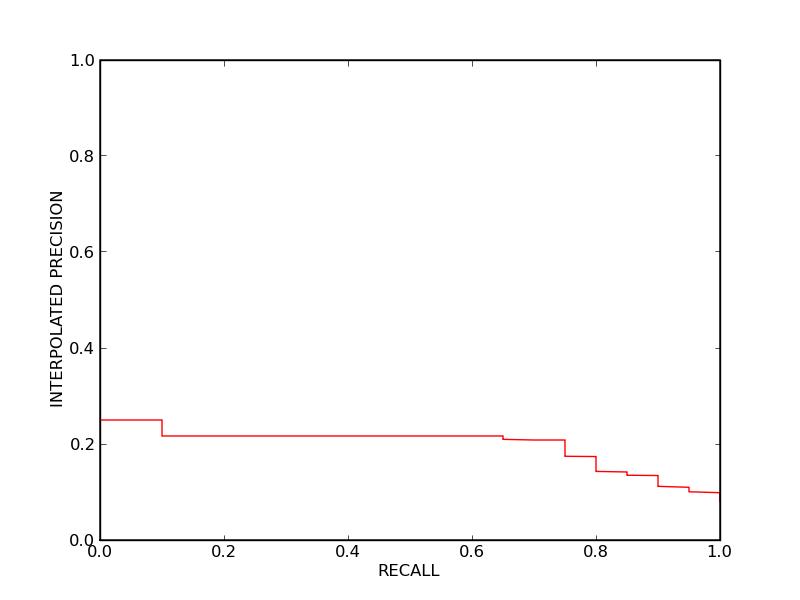
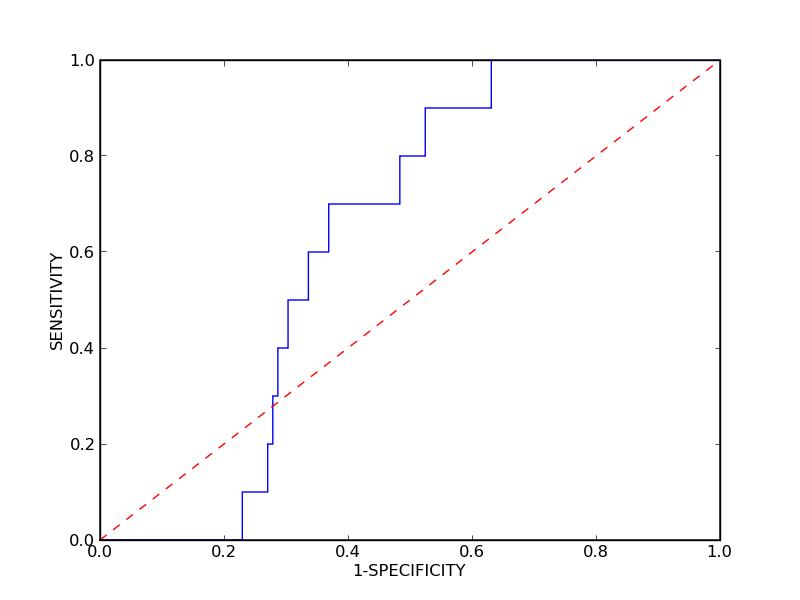
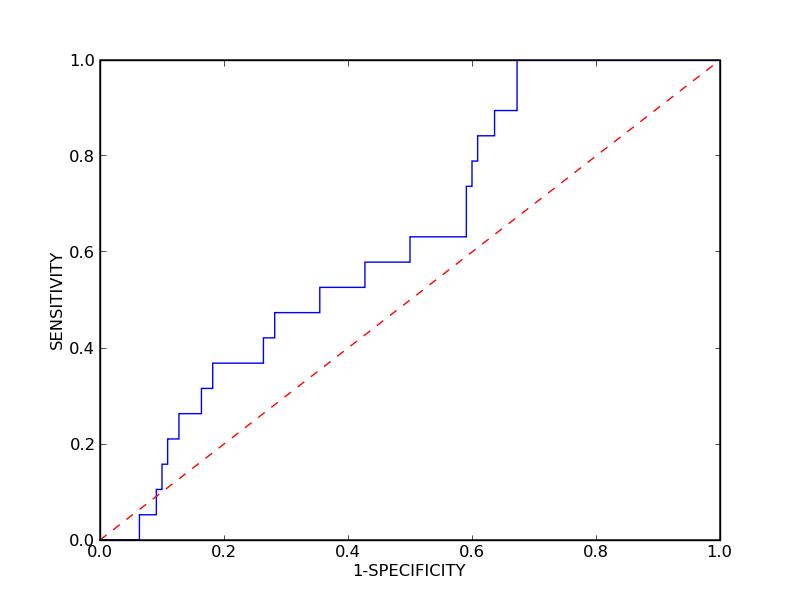
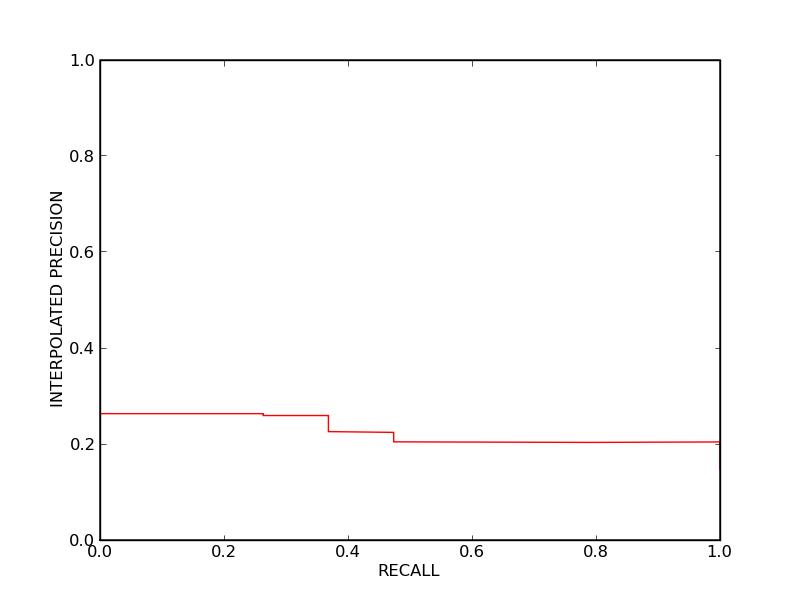
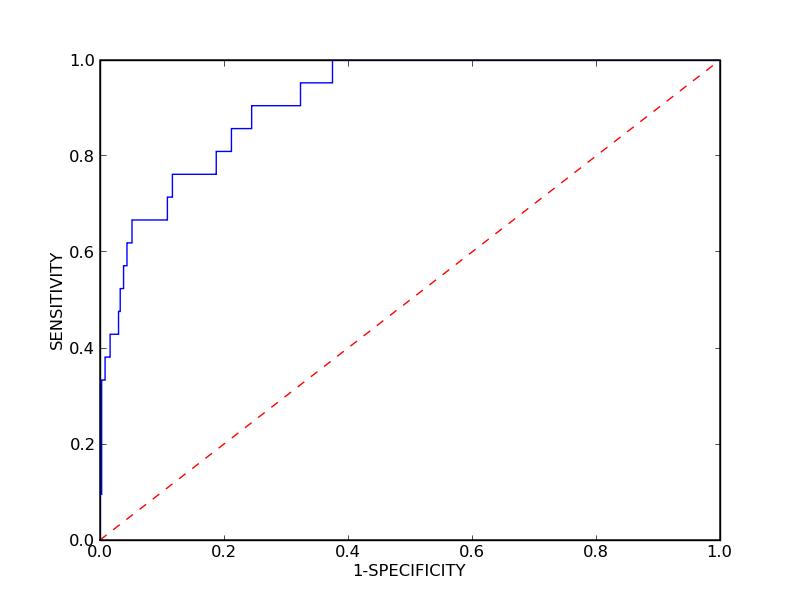
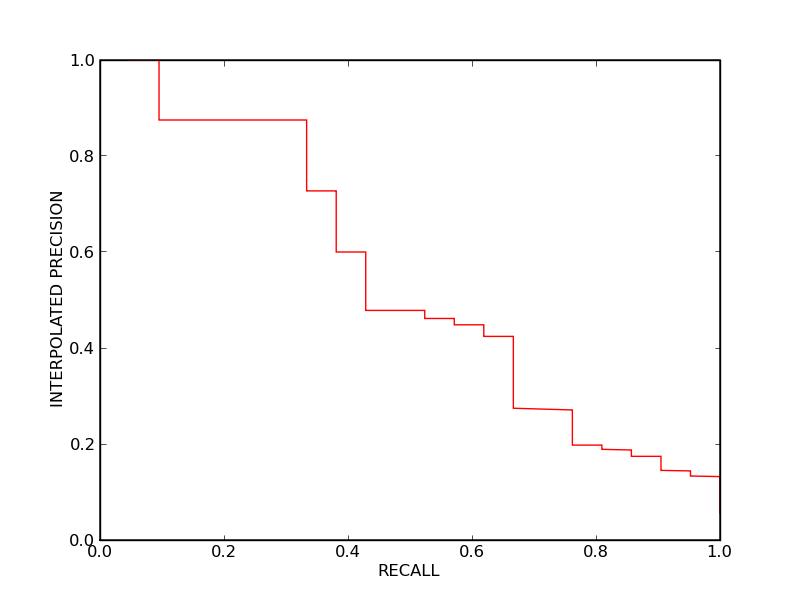
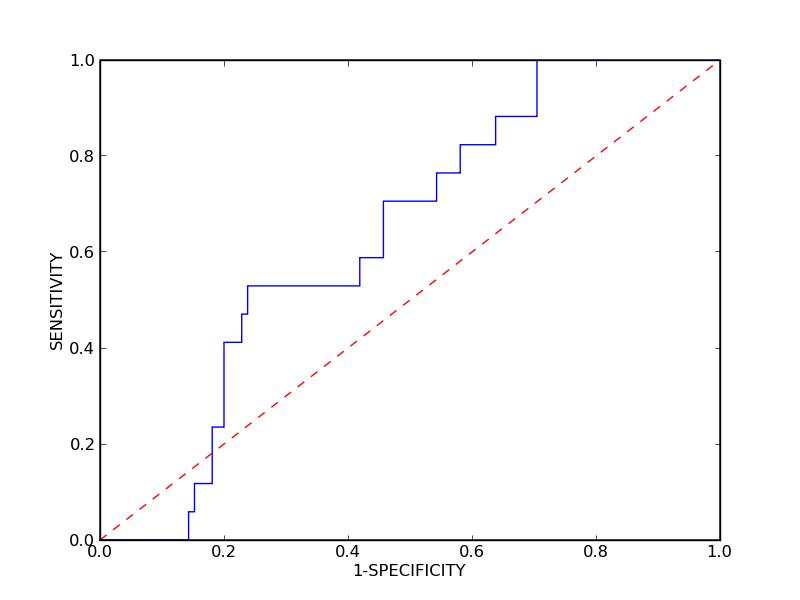
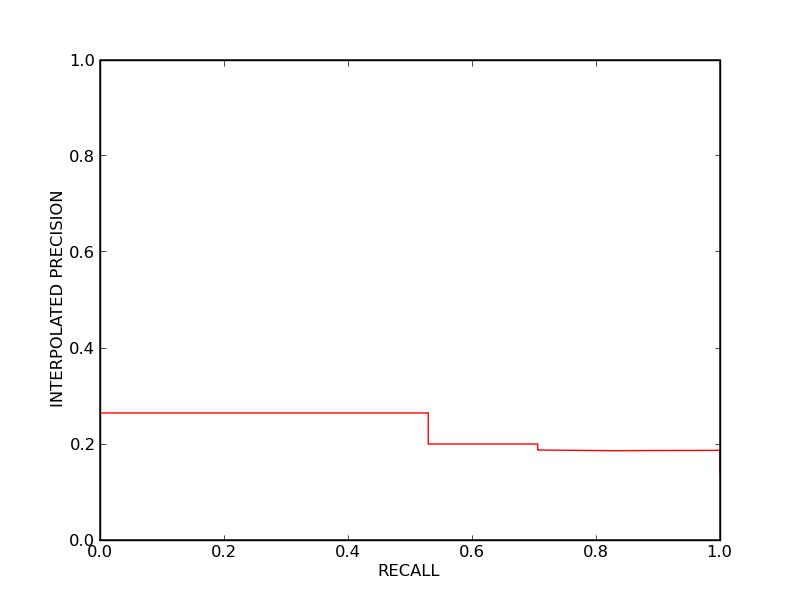
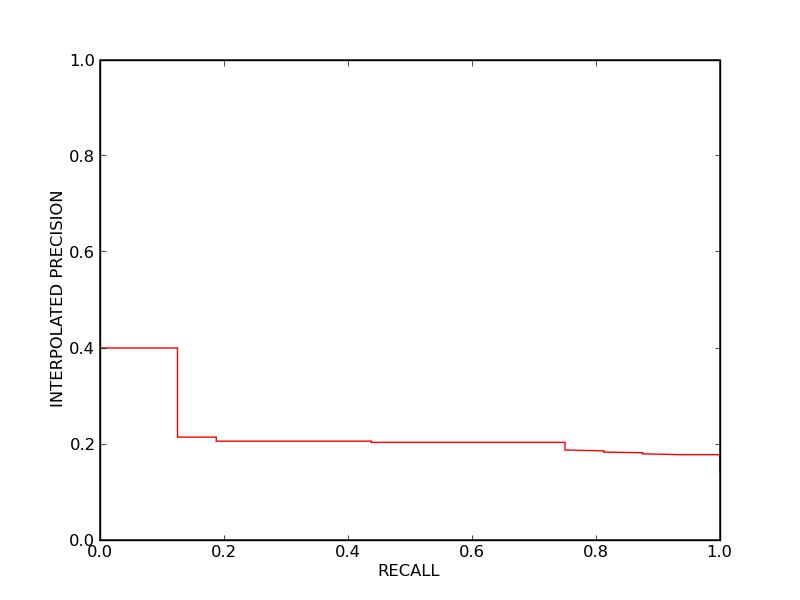
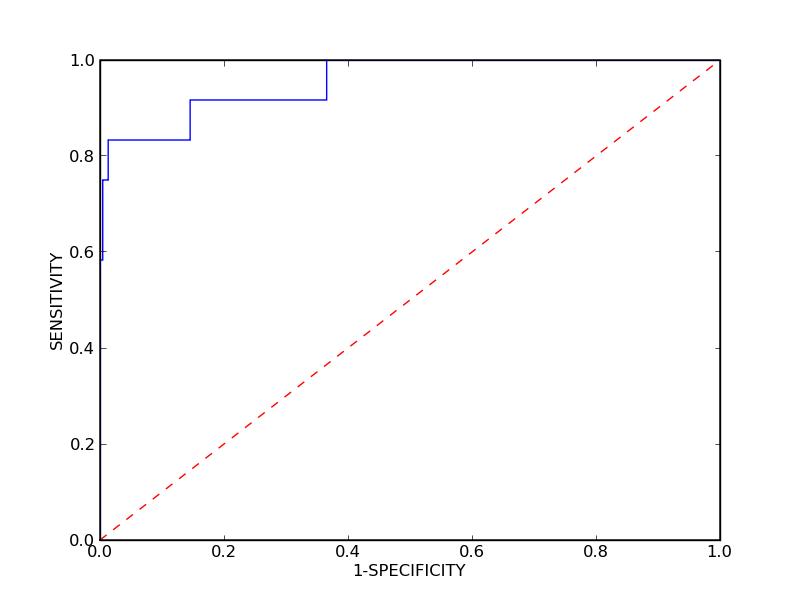
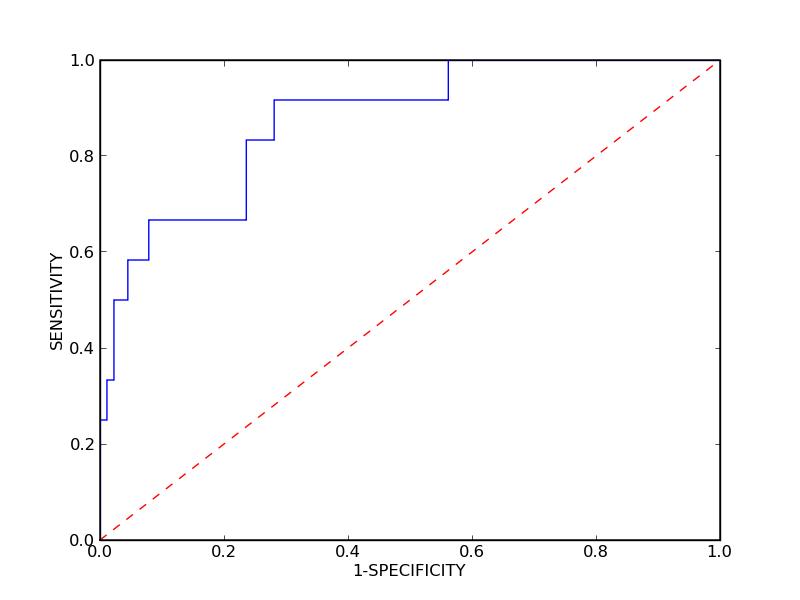
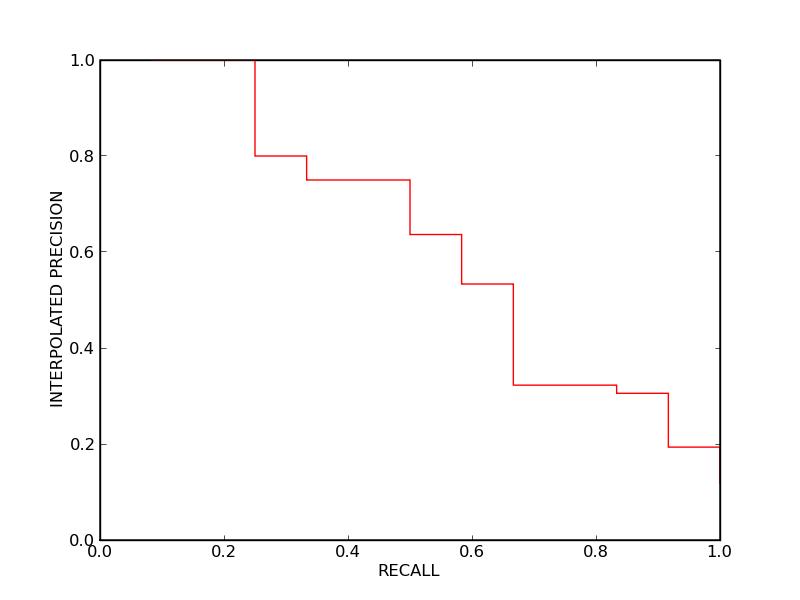
Protein Family IDs: 1jrhI 1jpsT
ROC Area Under the Curve (Family Average): 0.65917
Precision-Recall Equal Point (Family Average): 0.238095
Average Precision (Family Average): 0.22395
ROC Area Under the Curve (Family Average): 0.65917
Precision-Recall Equal Point (Family Average): 0.238095
Average Precision (Family Average): 0.22395
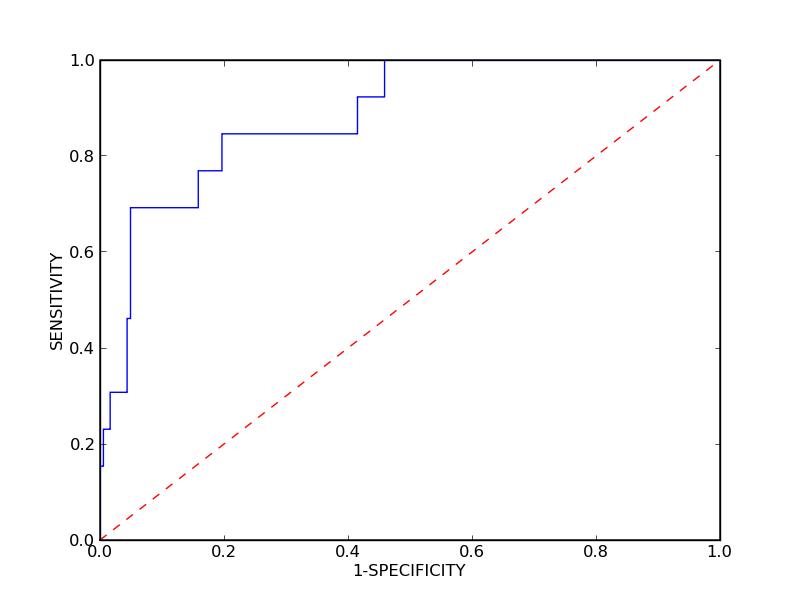
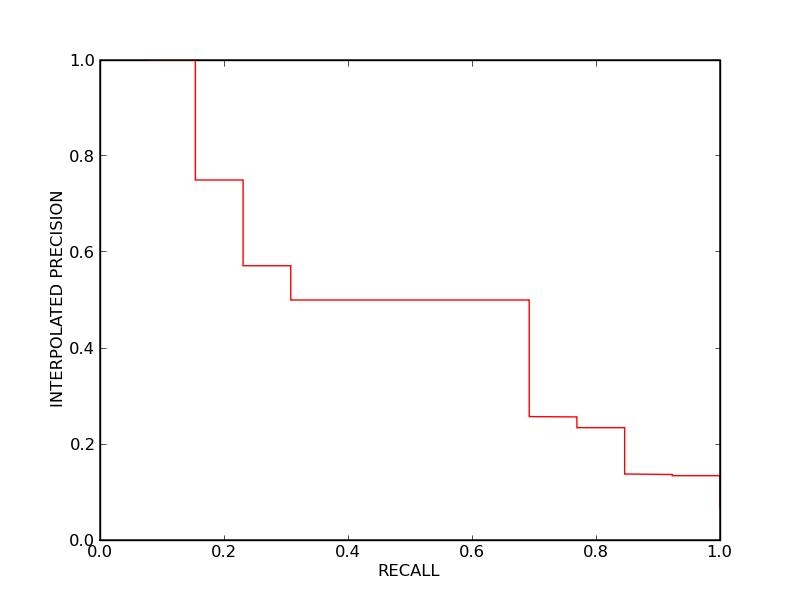
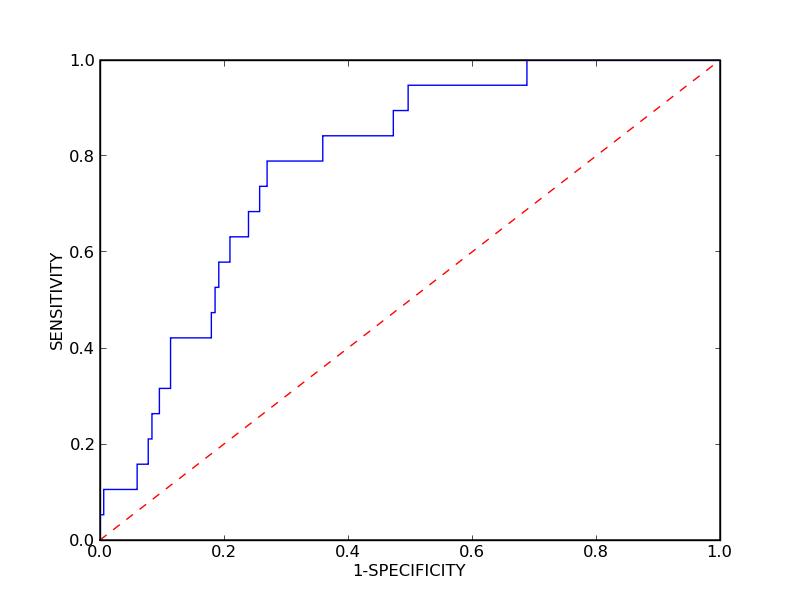
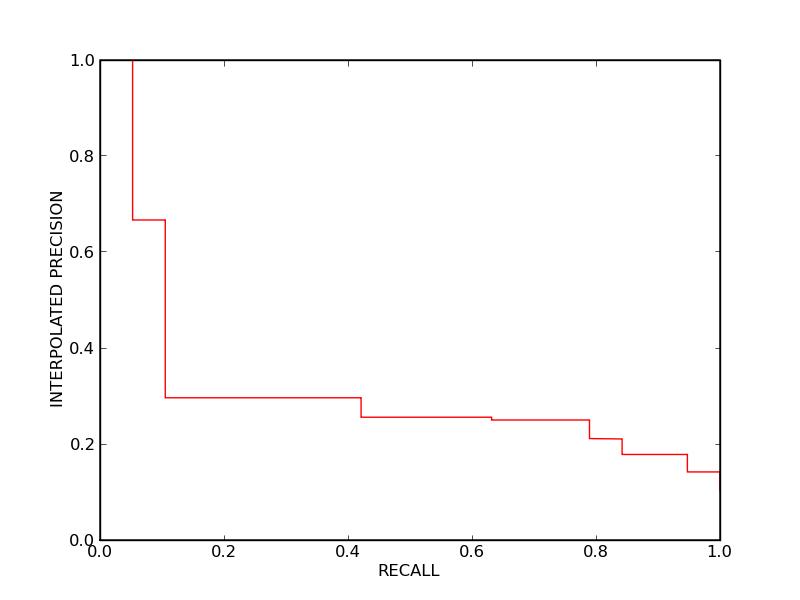
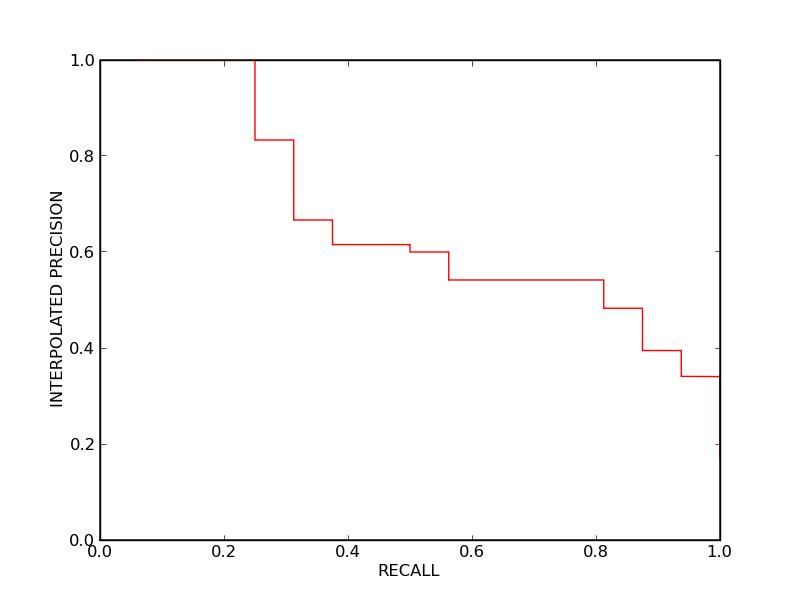
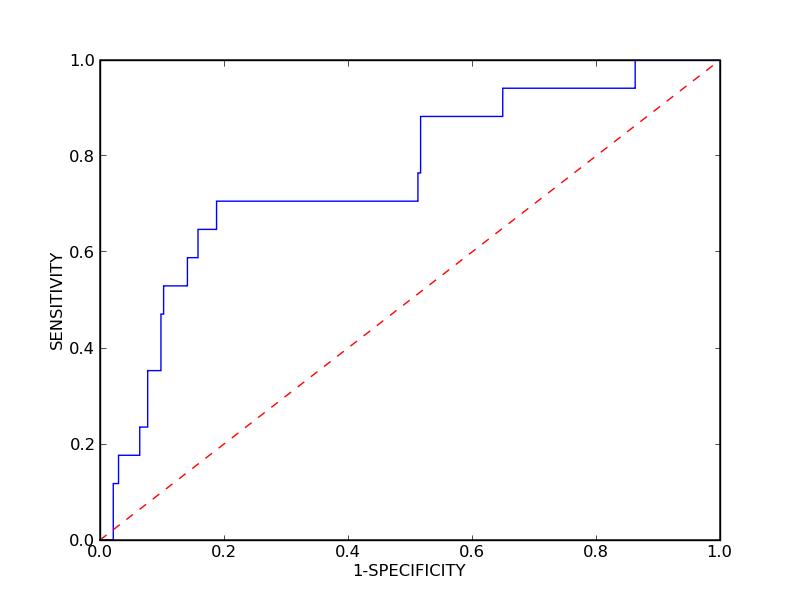
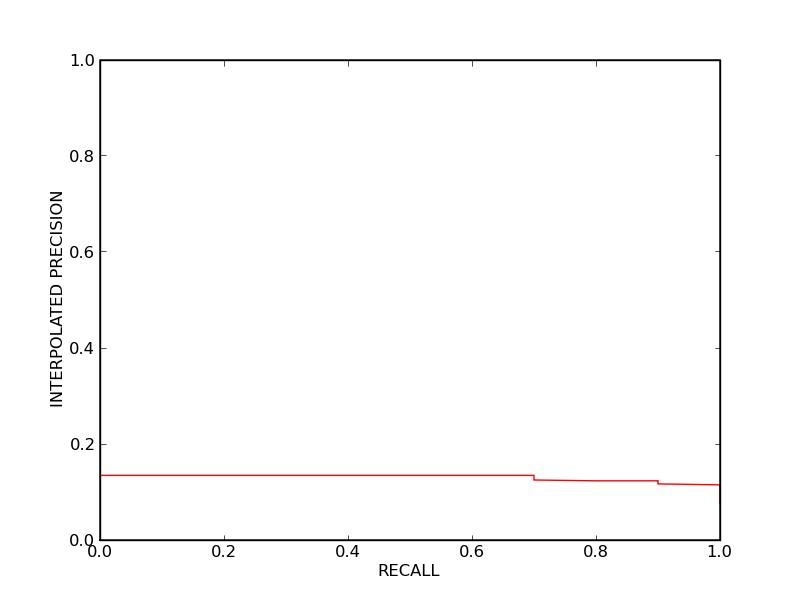
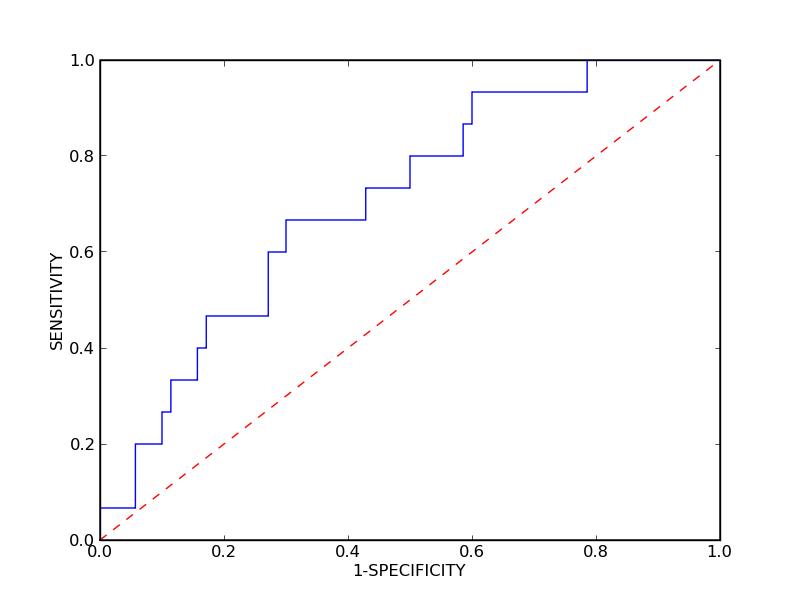
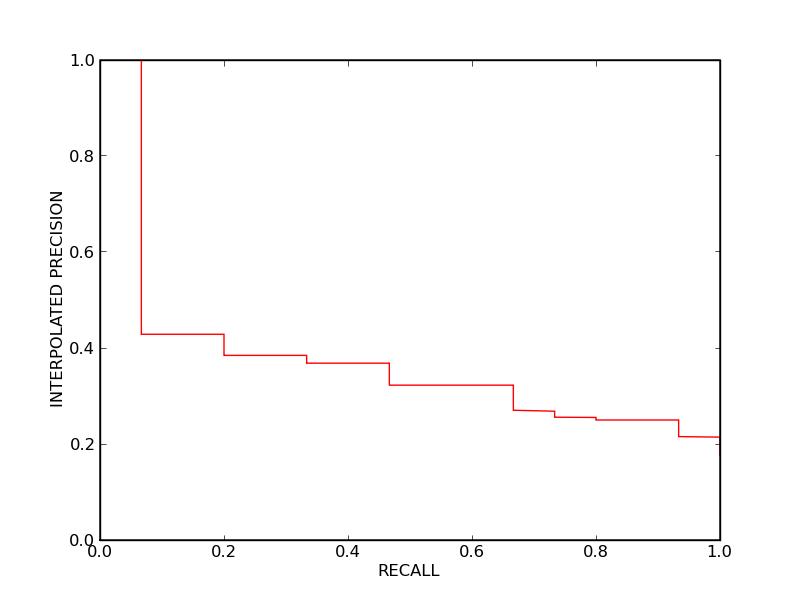
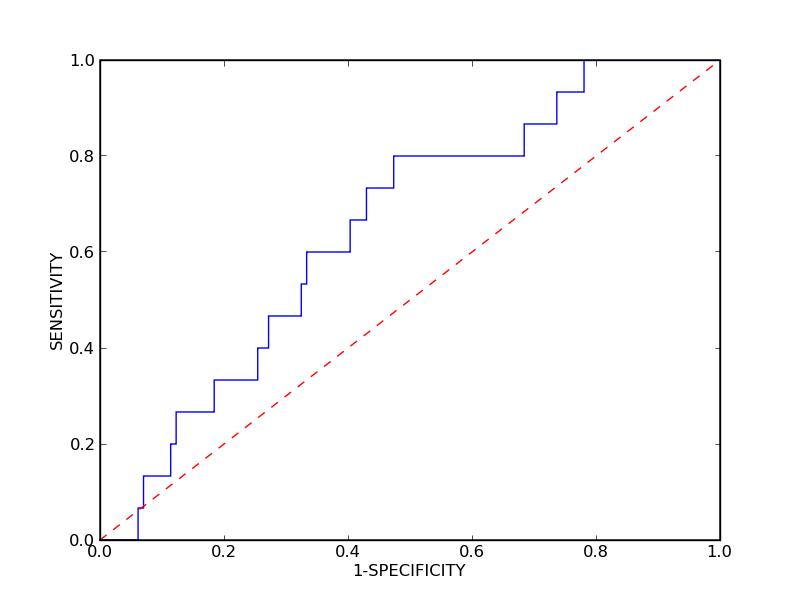
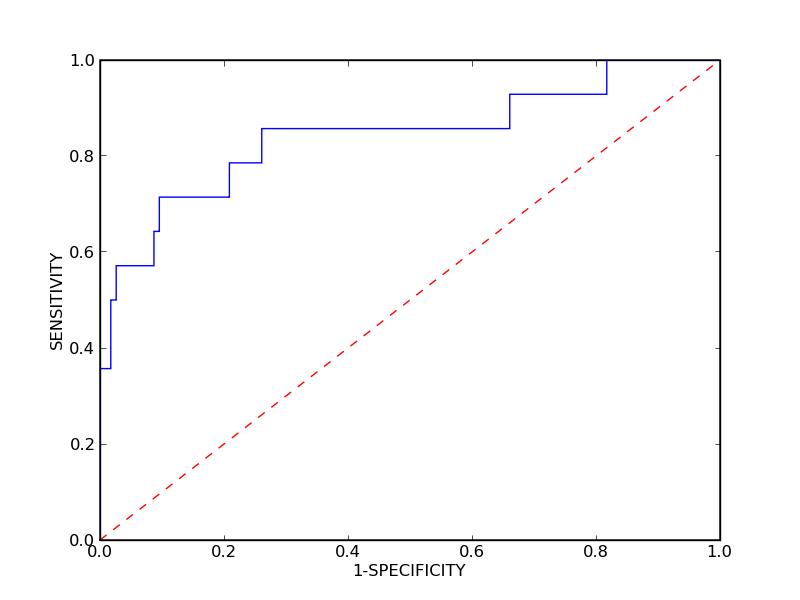
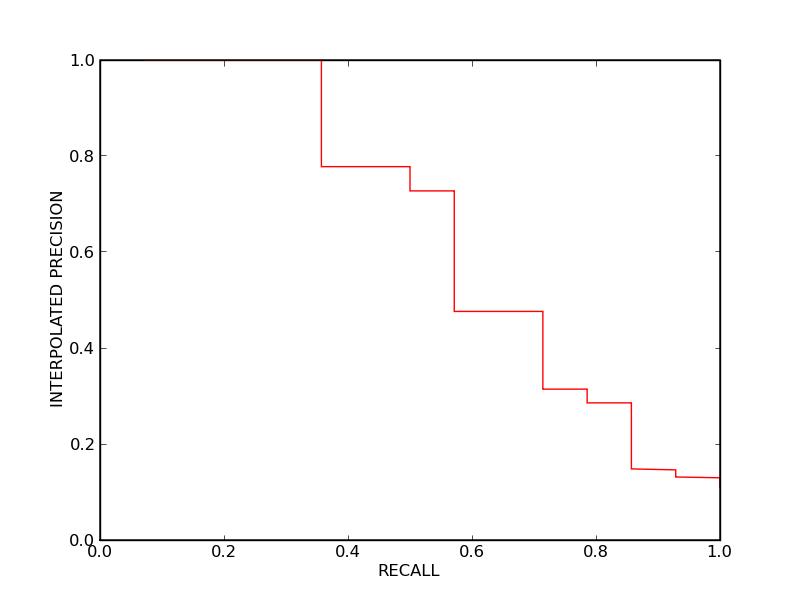
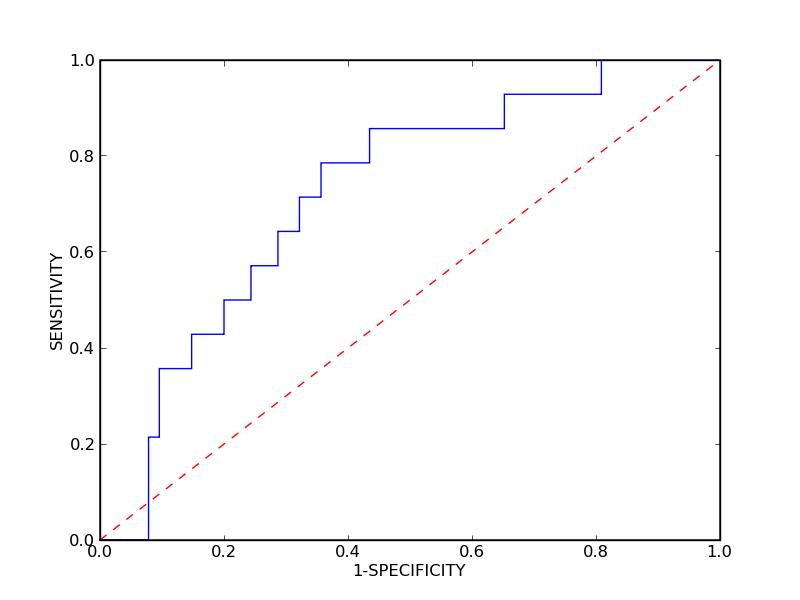
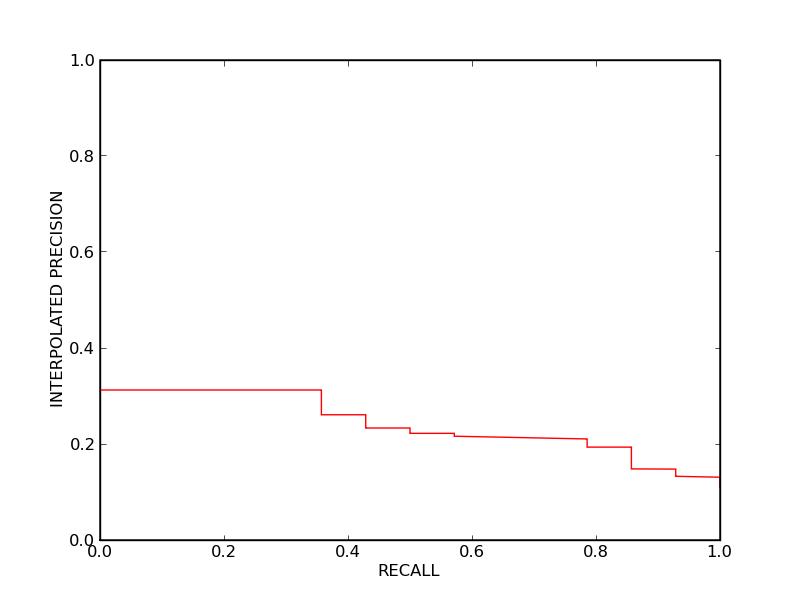
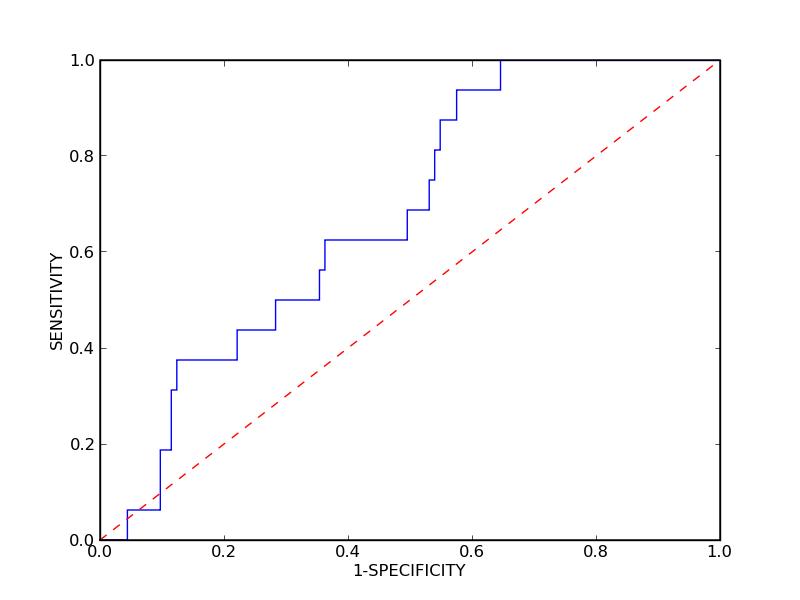
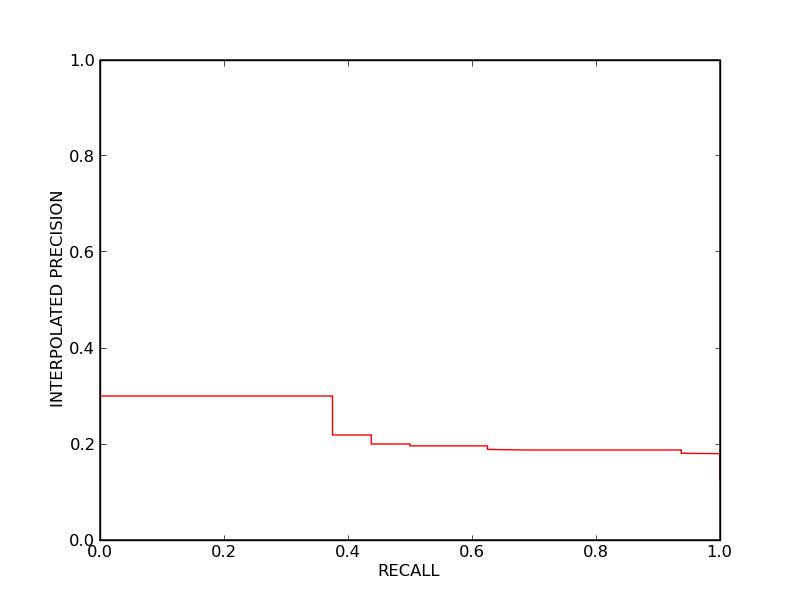
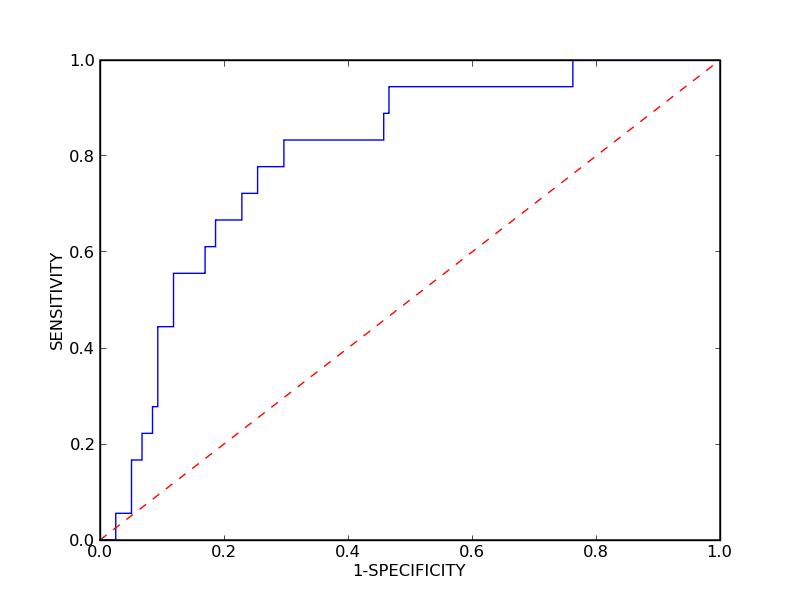
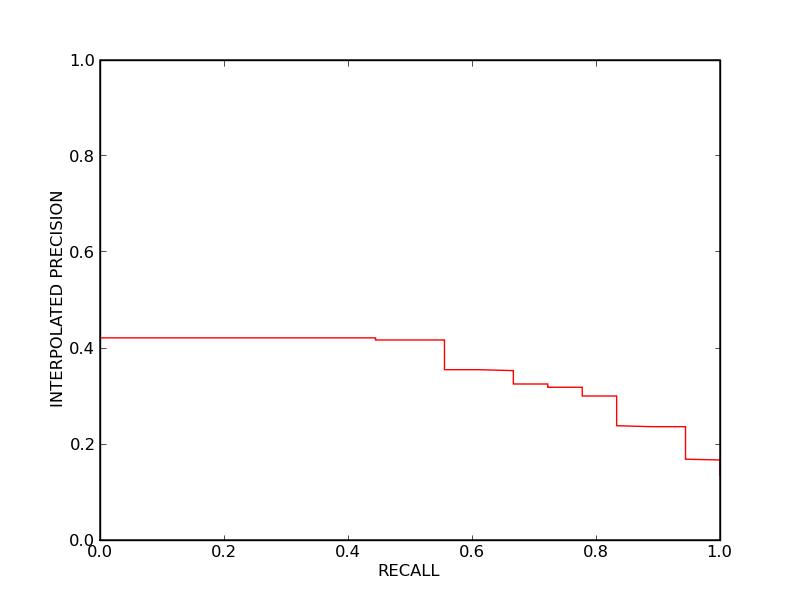
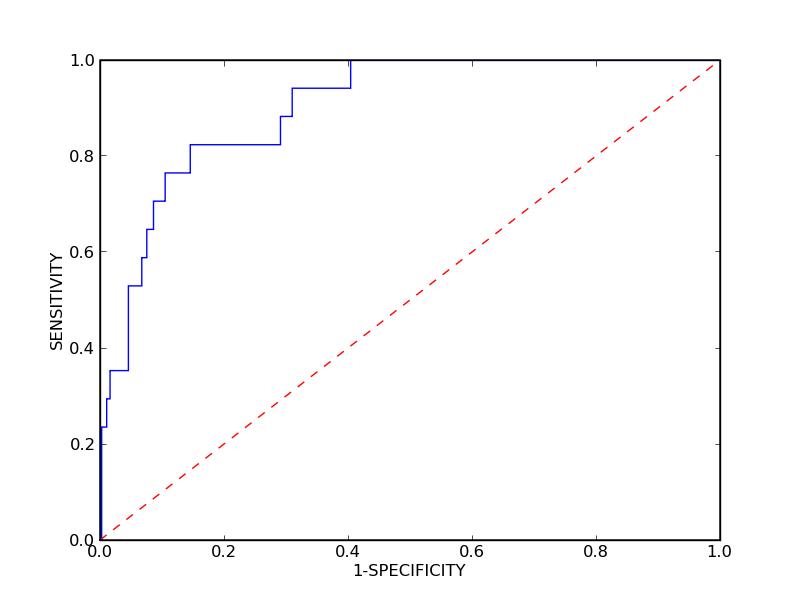
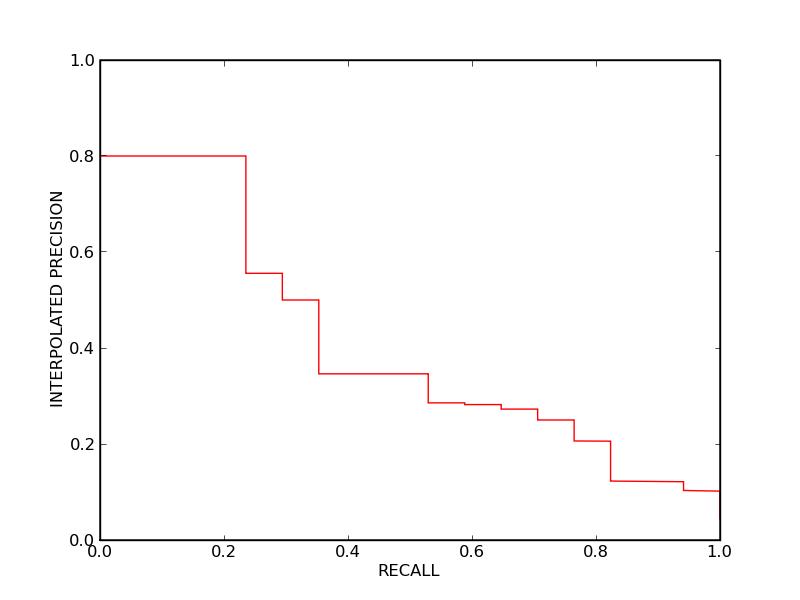
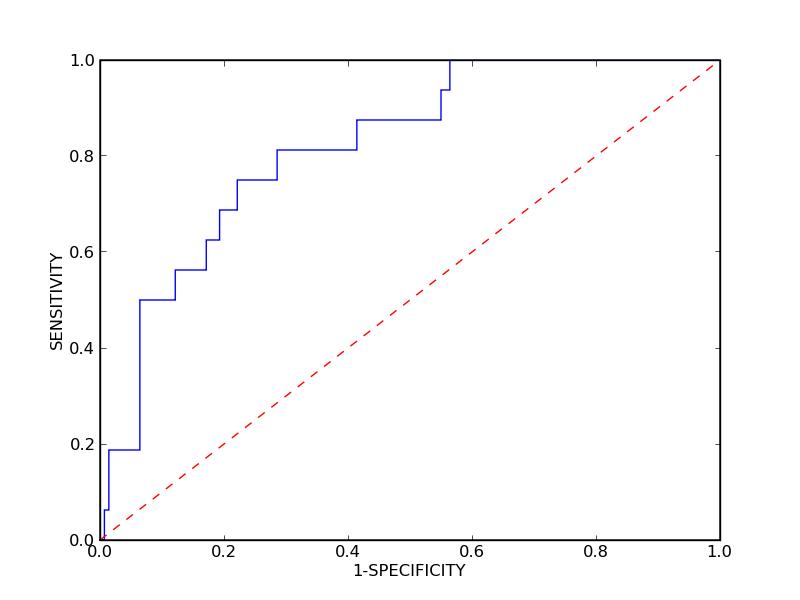
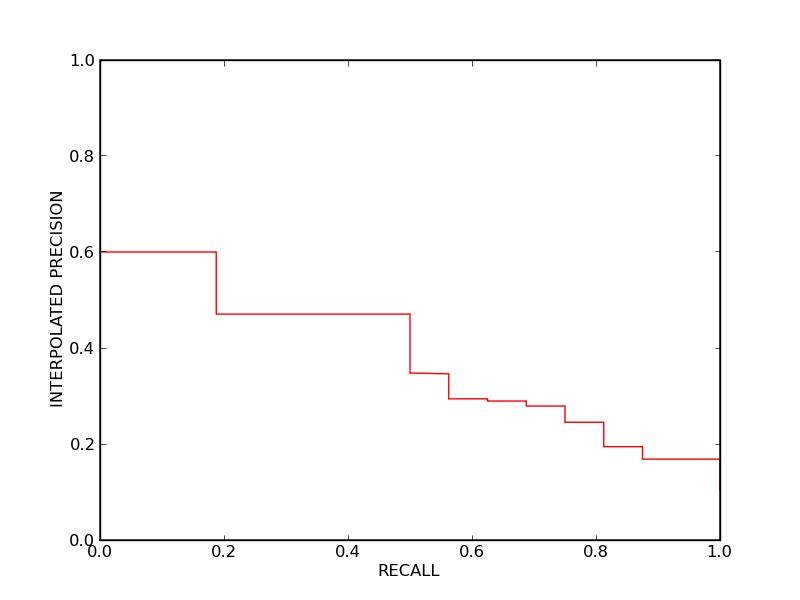
Protein Family IDs: 1mhpA 1fe8A 1fnsA 1oakA
ROC Area Under the Curve (Family Average): 0.856475
Precision-Recall Equal Point (Family Average): 0.3234025
Average Precision (Family Average): 0.408355
ROC Area Under the Curve (Family Average): 0.856475
Precision-Recall Equal Point (Family Average): 0.3234025
Average Precision (Family Average): 0.408355
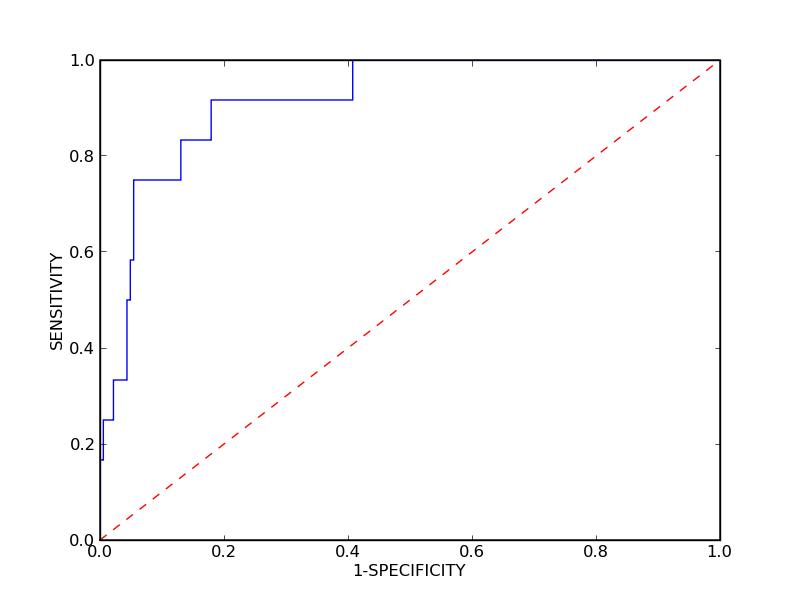
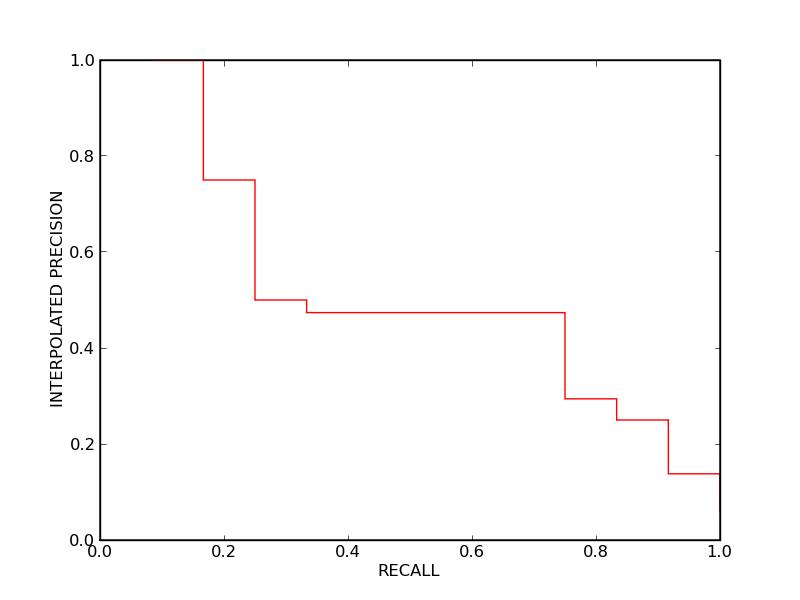
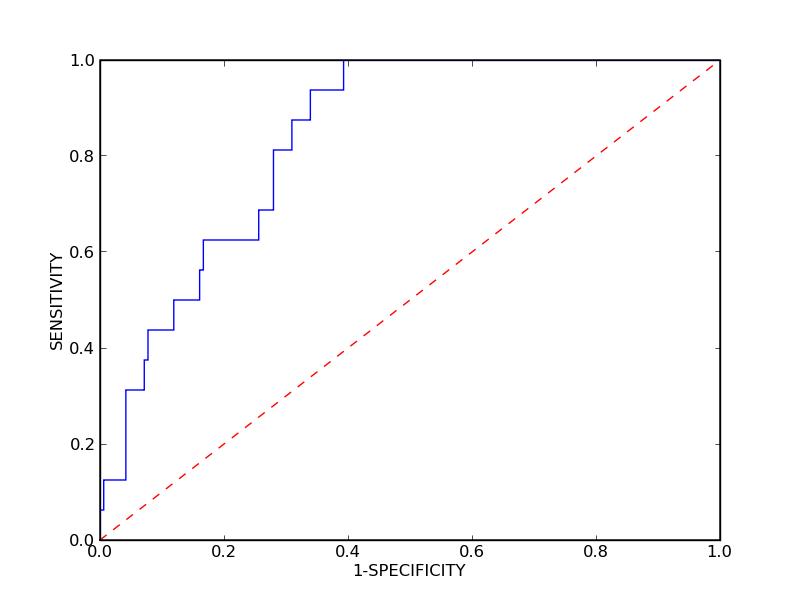
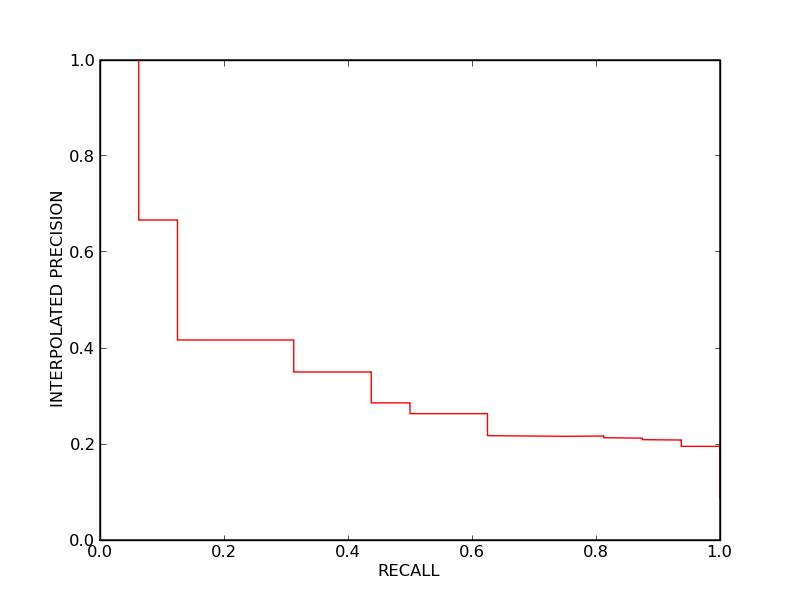
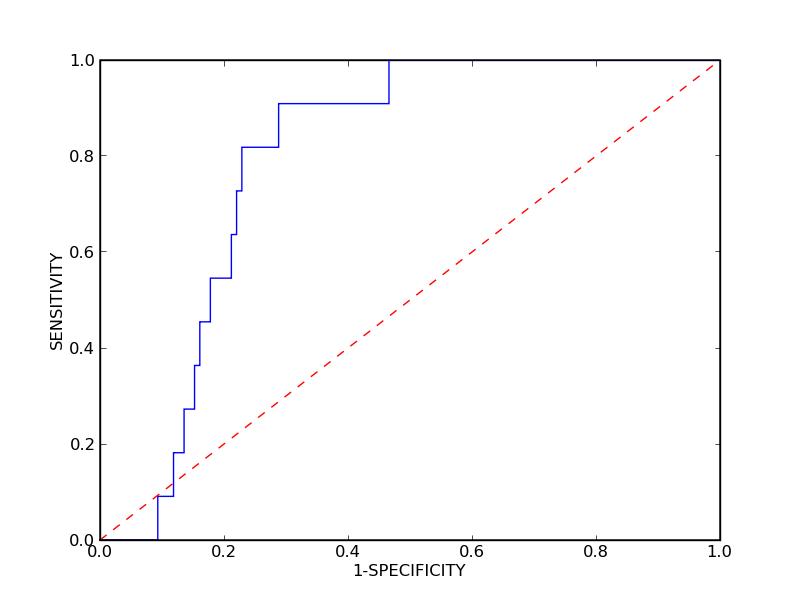
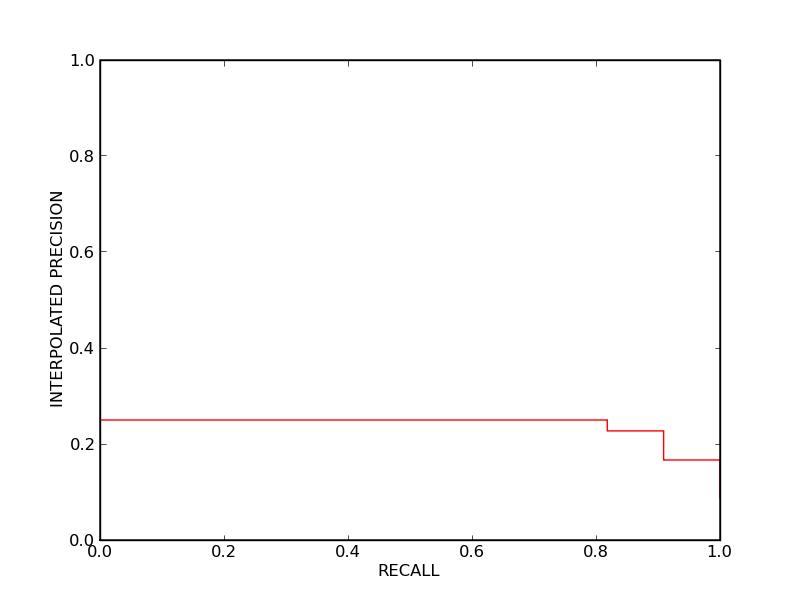
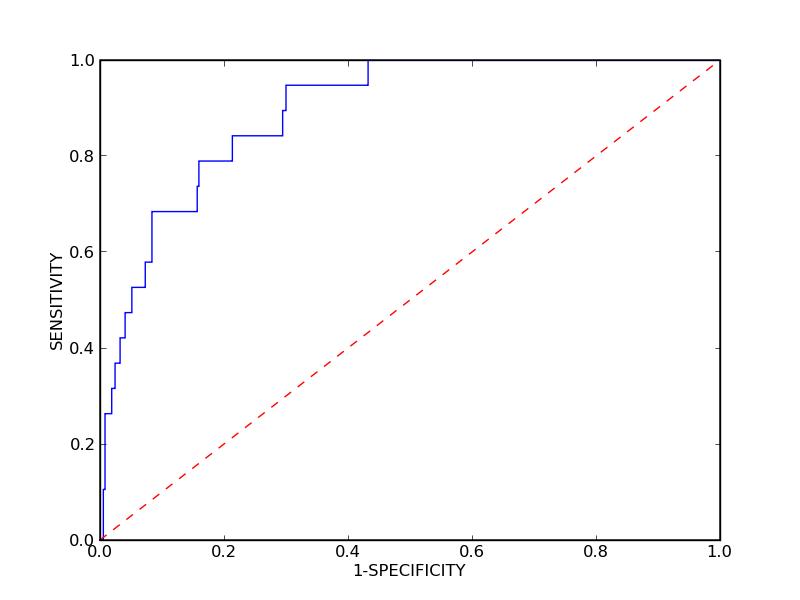
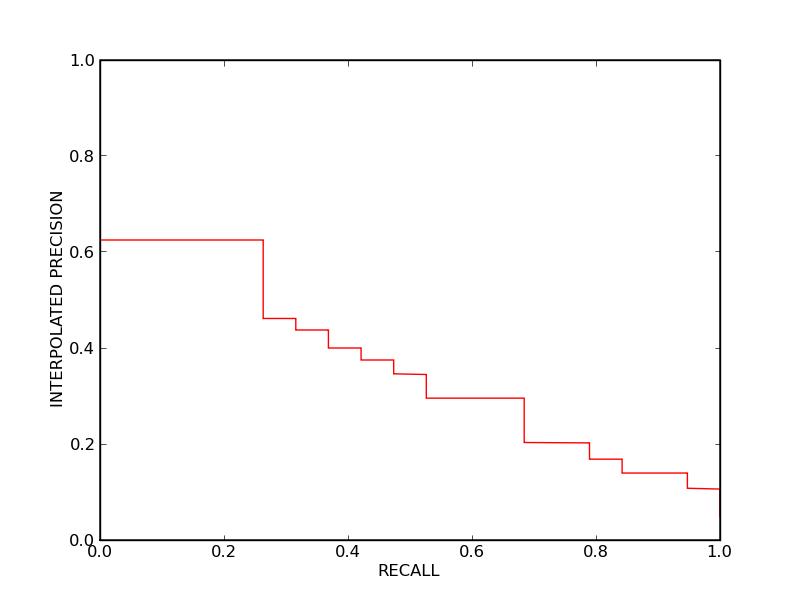
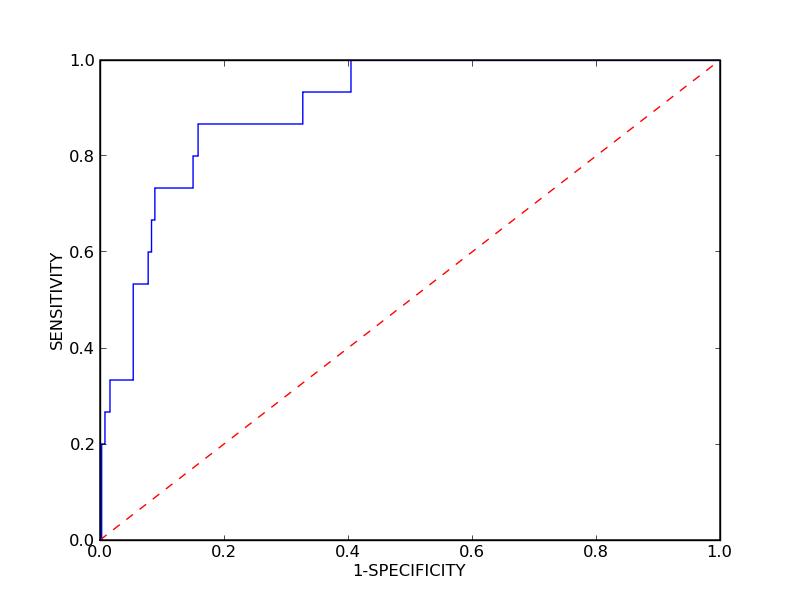
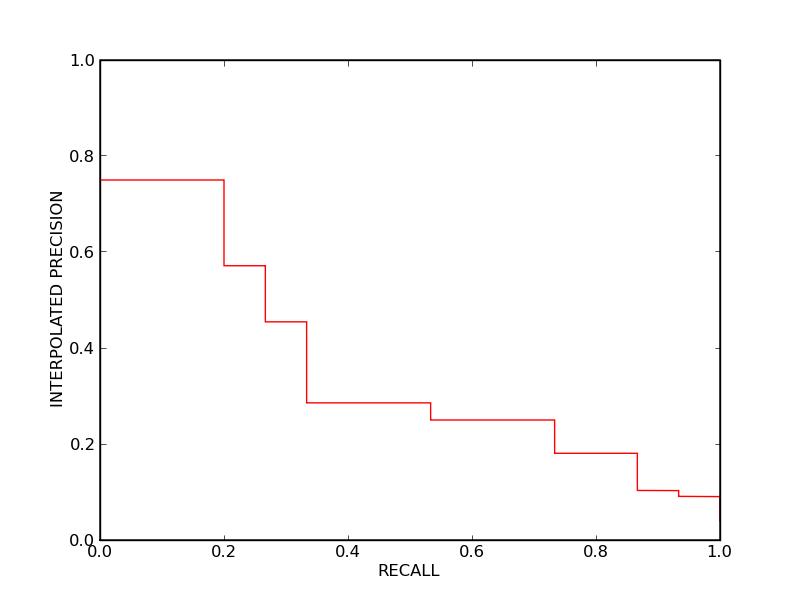
Protein Family IDs: 1cz8W 1bj1W 1tzhV
ROC Area Under the Curve (Family Average): 0.916723333333
Precision-Recall Equal Point (Family Average): 0.60577
Average Precision (Family Average): 0.717566666667
ROC Area Under the Curve (Family Average): 0.916723333333
Precision-Recall Equal Point (Family Average): 0.60577
Average Precision (Family Average): 0.717566666667

Protein Family IDs: 1fj1F 1ospO
ROC Area Under the Curve (Family Average): 0.758635
Precision-Recall Equal Point (Family Average): 0.163235
Average Precision (Family Average): 0.19039
ROC Area Under the Curve (Family Average): 0.758635
Precision-Recall Equal Point (Family Average): 0.163235
Average Precision (Family Average): 0.19039
Protein Family IDs: 1orsC
ROC Area Under the Curve (Family Average): 0.62869
Precision-Recall Equal Point (Family Average): 0.0
Average Precision (Family Average): 0.10142
ROC Area Under the Curve (Family Average): 0.62869
Precision-Recall Equal Point (Family Average): 0.0
Average Precision (Family Average): 0.10142
Protein Family IDs: 2jelP
ROC Area Under the Curve (Family Average): 0.70667
Precision-Recall Equal Point (Family Average): 0.33333
Average Precision (Family Average): 0.36003
ROC Area Under the Curve (Family Average): 0.70667
Precision-Recall Equal Point (Family Average): 0.33333
Average Precision (Family Average): 0.36003
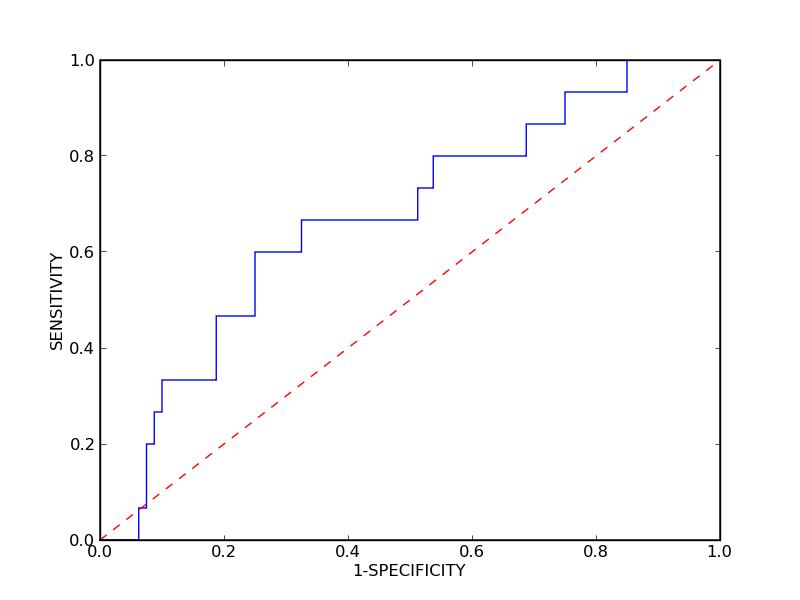
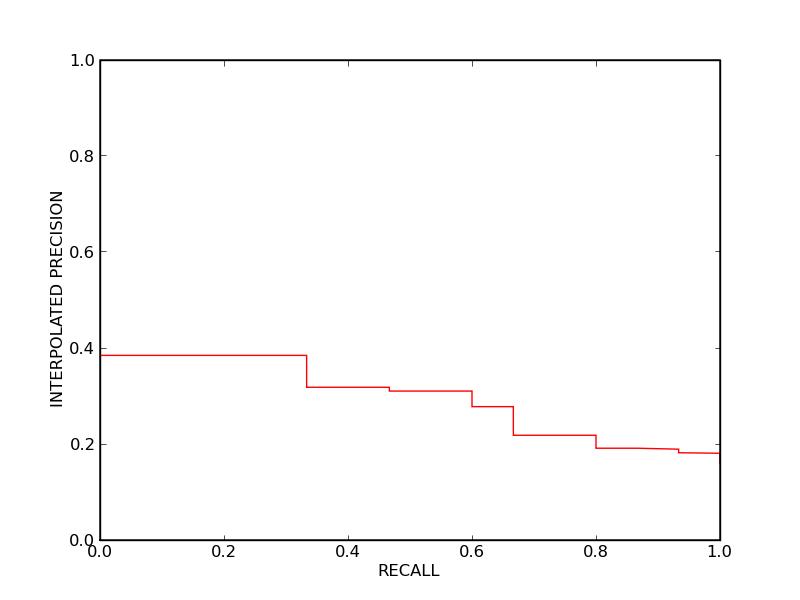
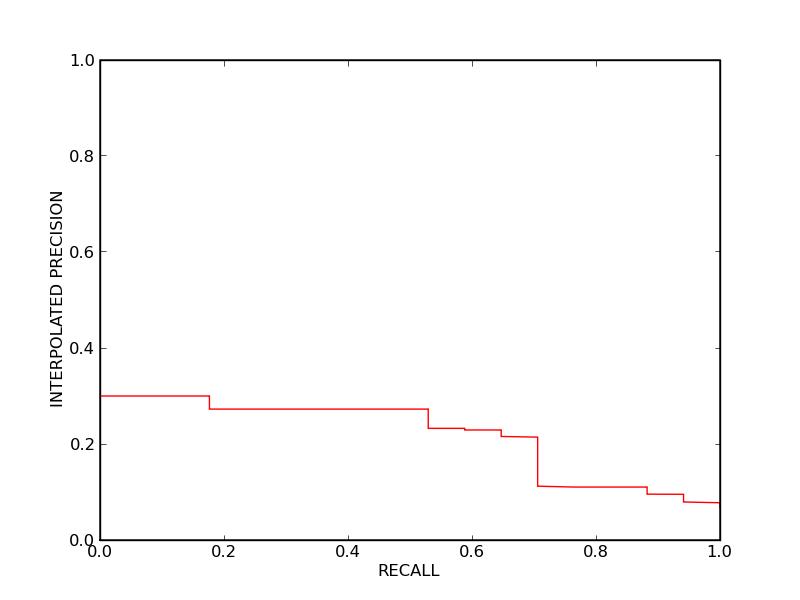
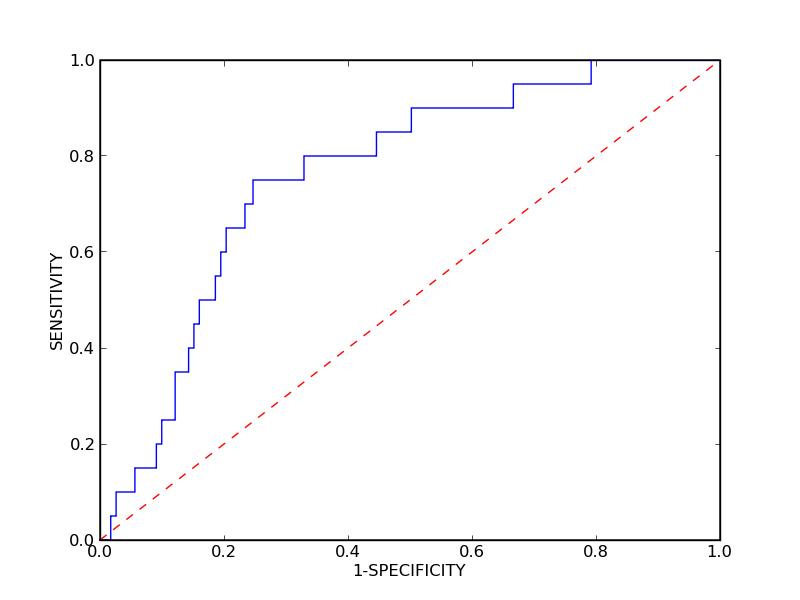
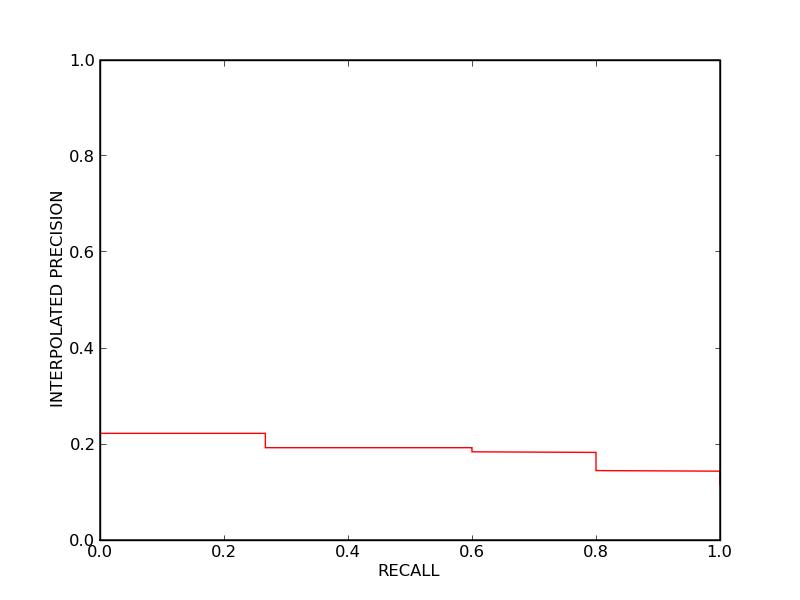
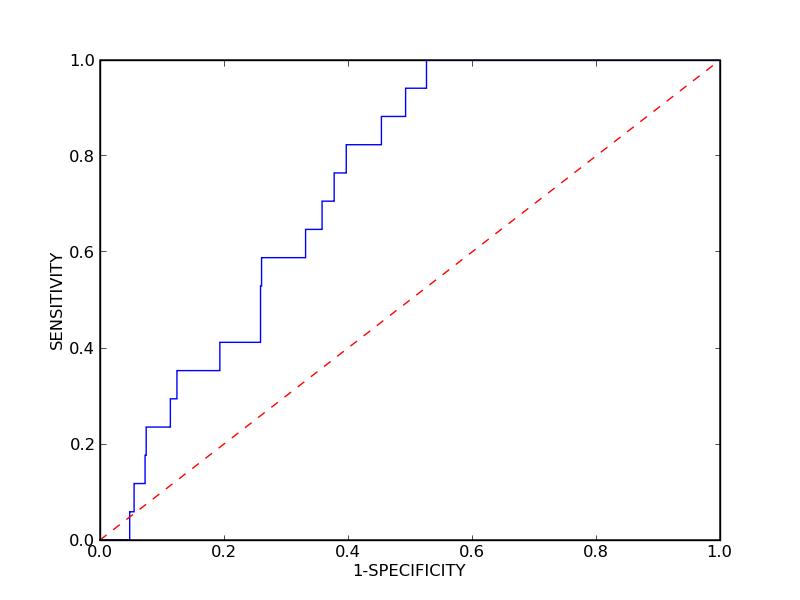
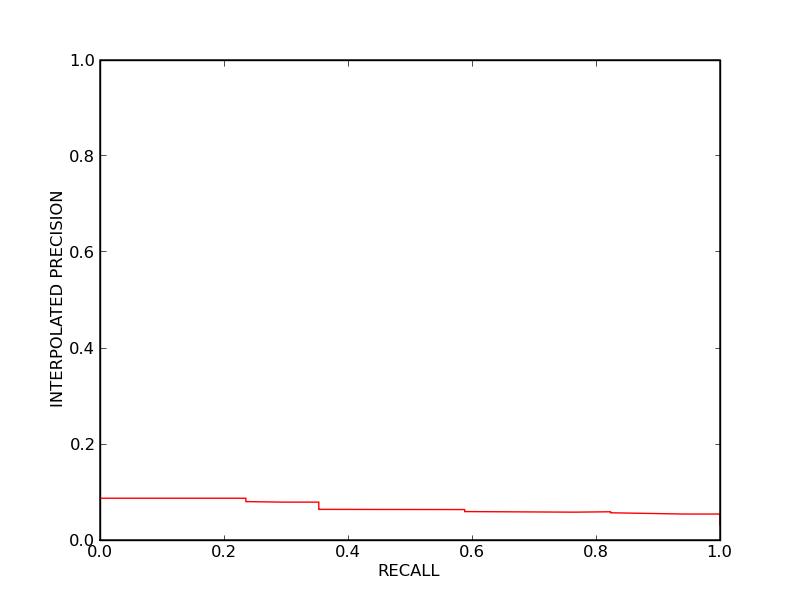
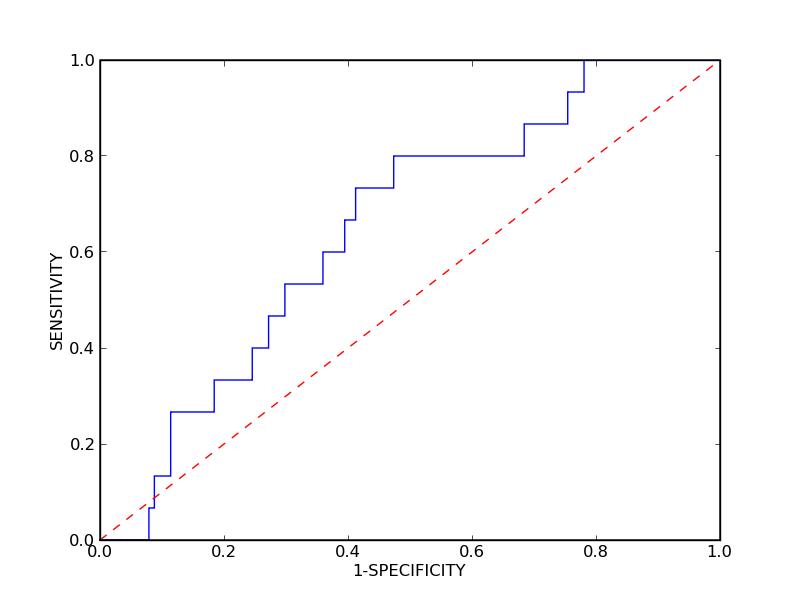
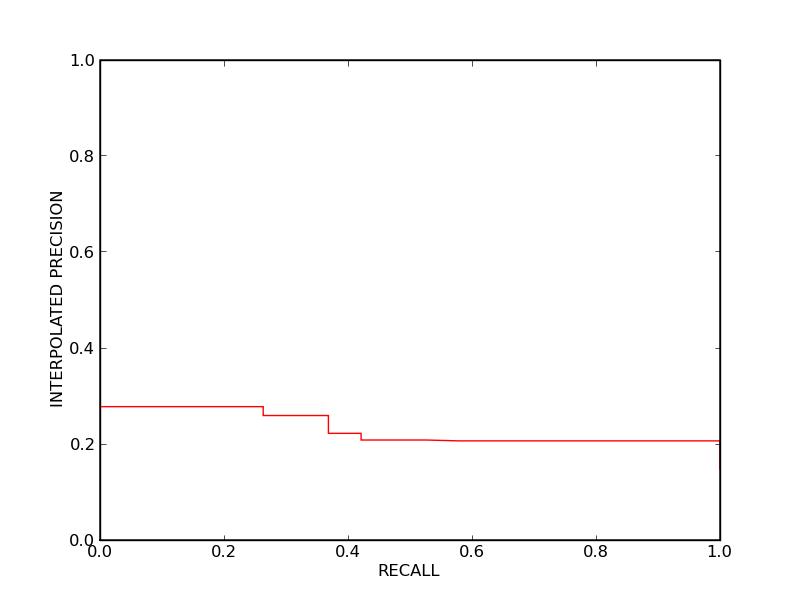
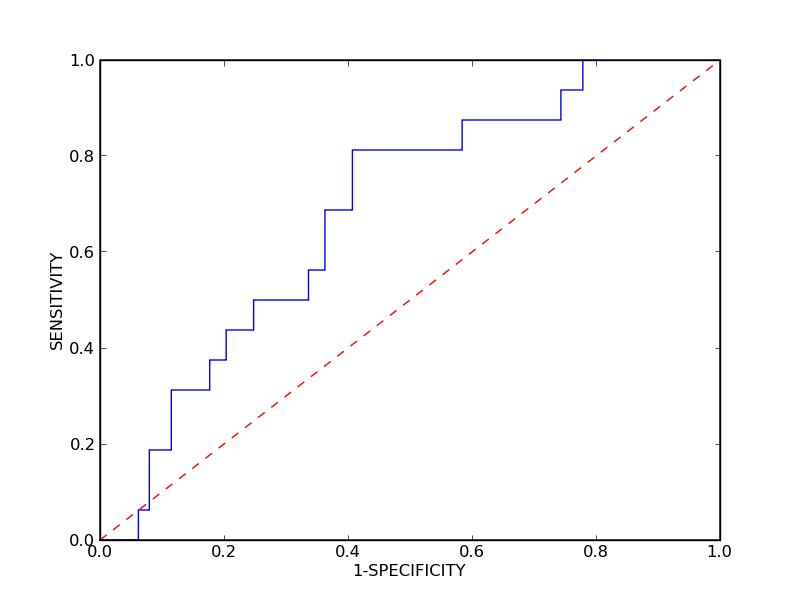
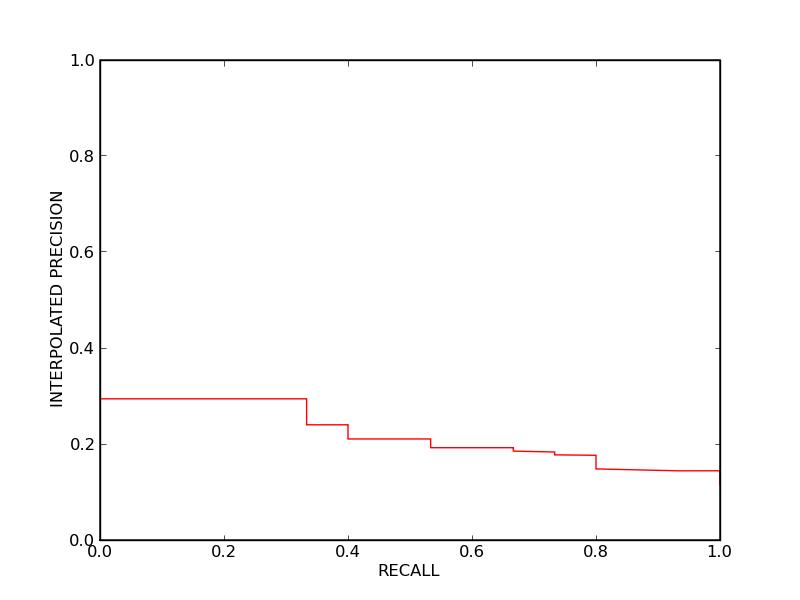
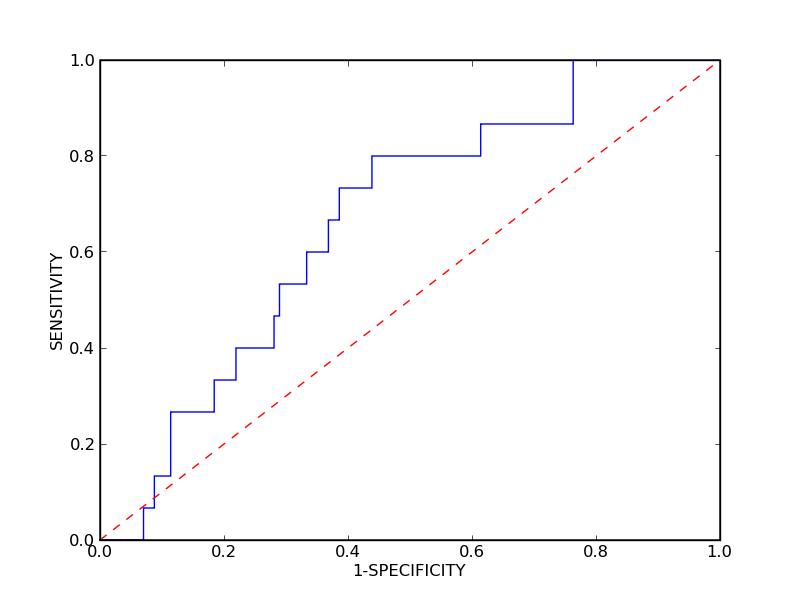
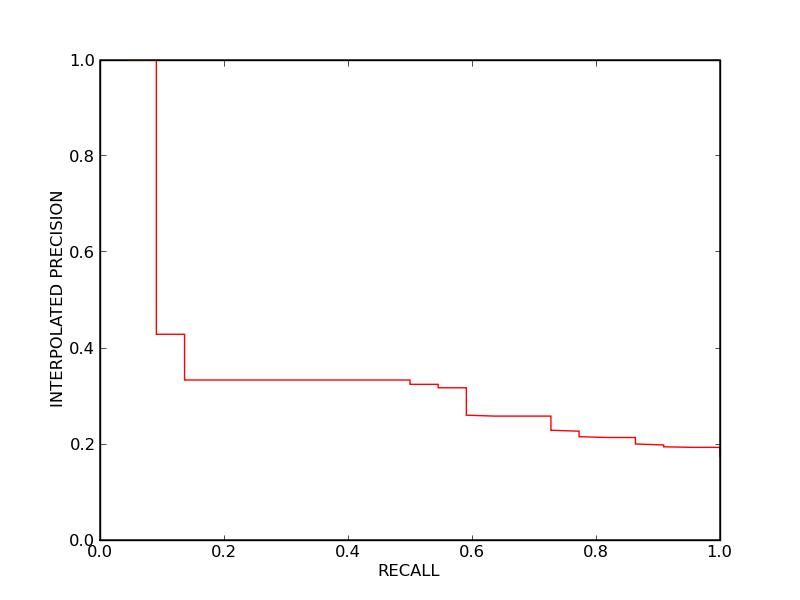
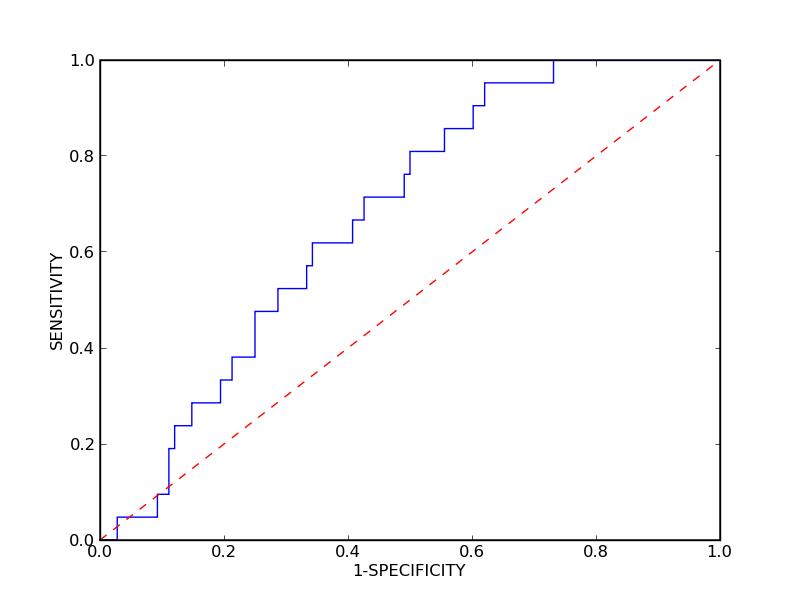
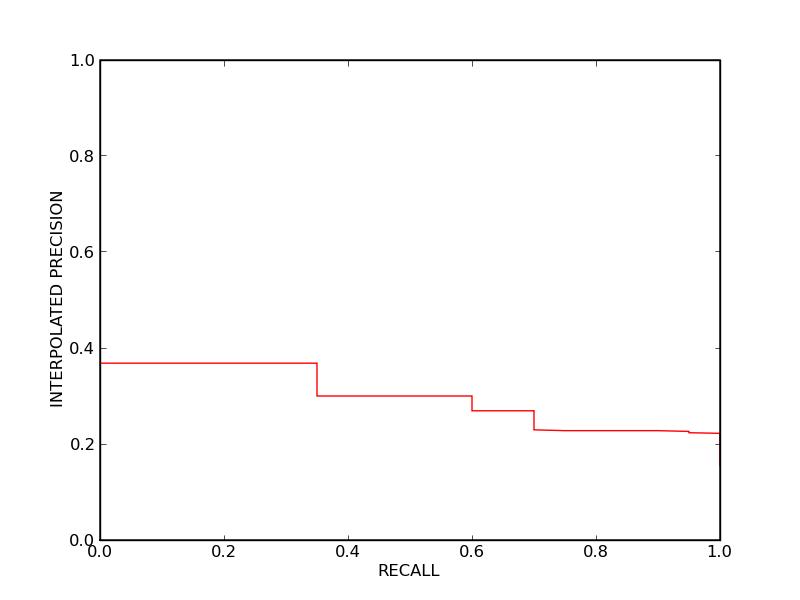
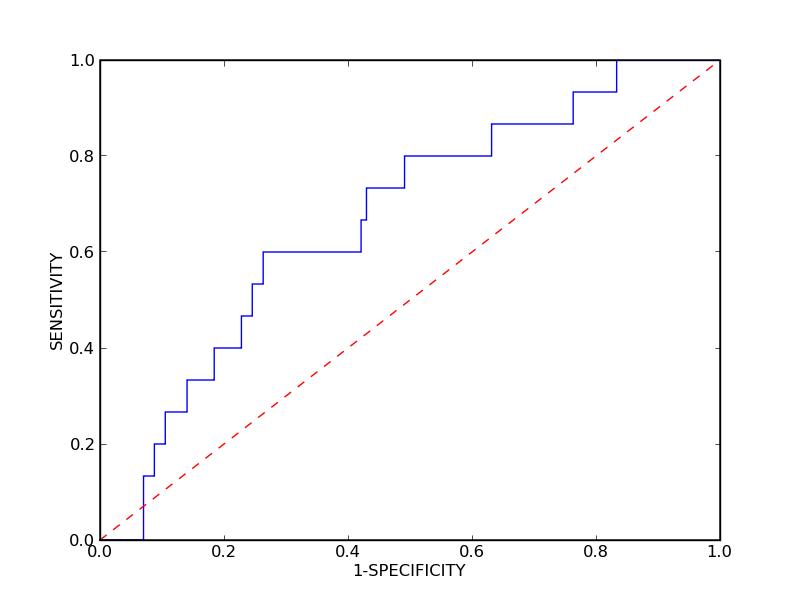
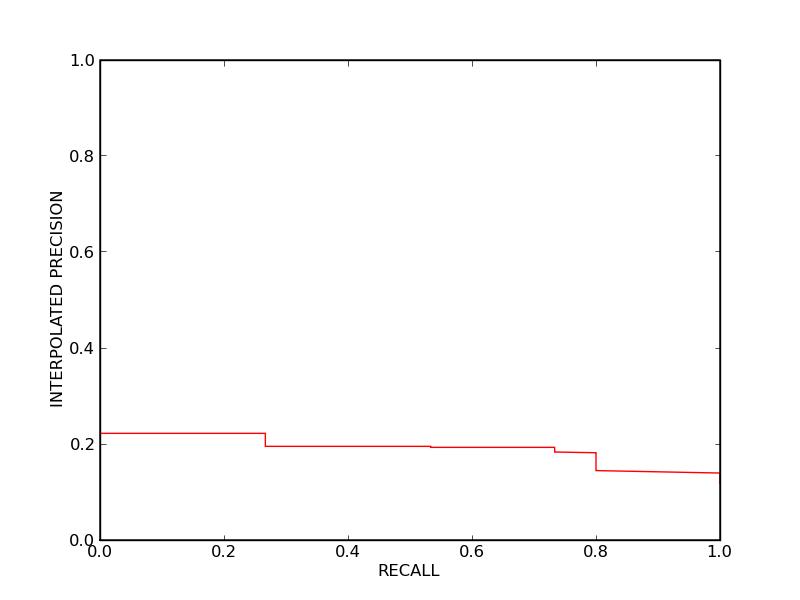
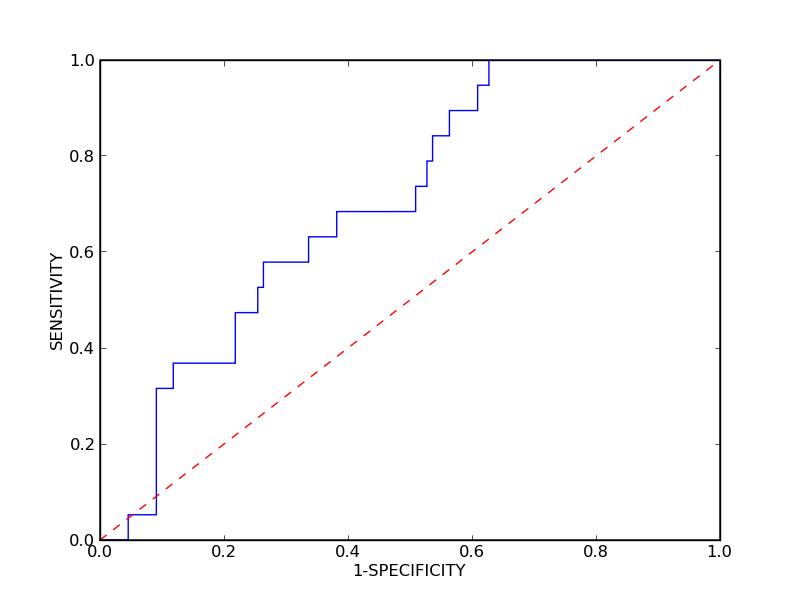
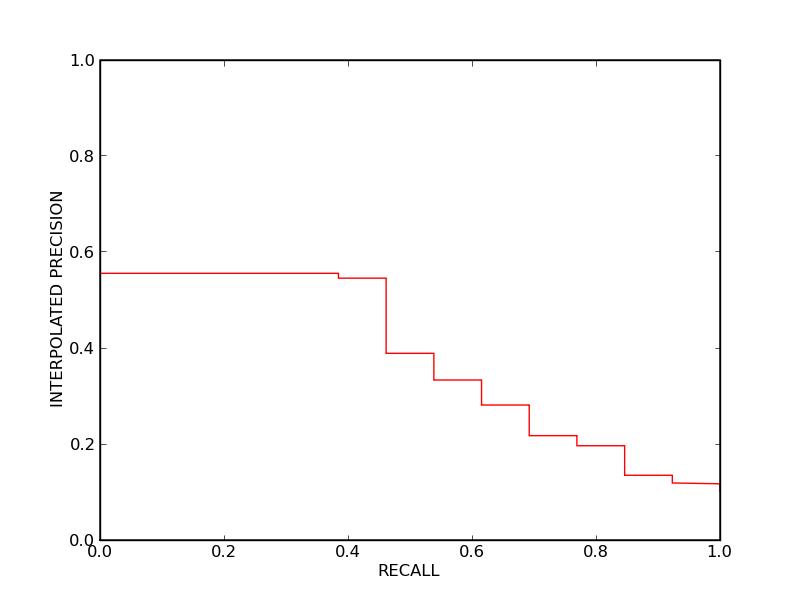
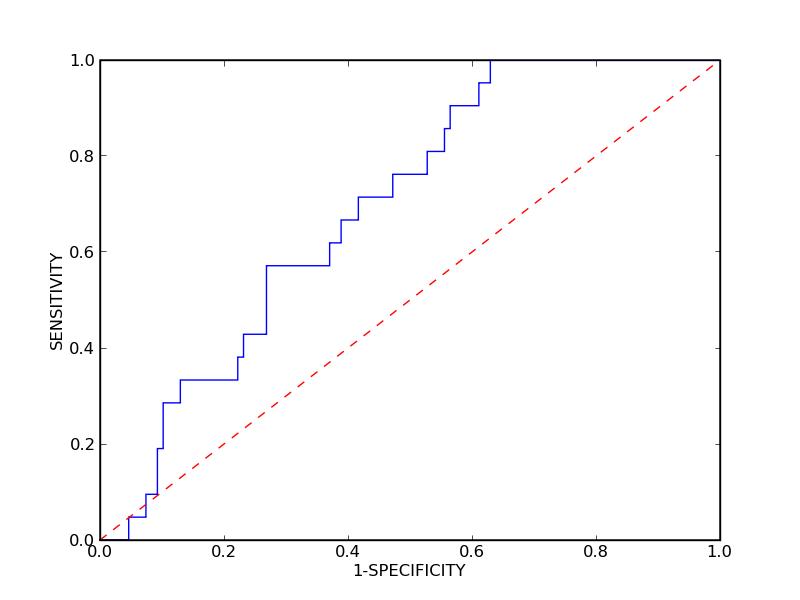
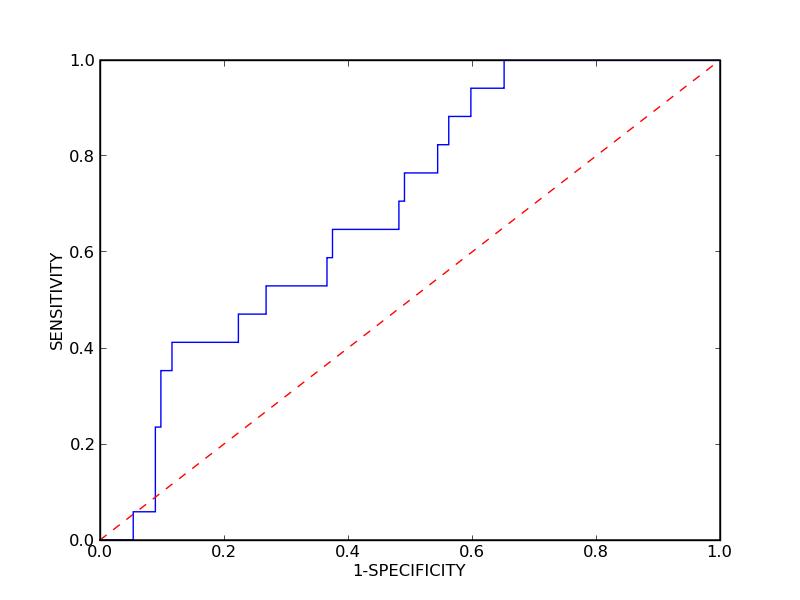
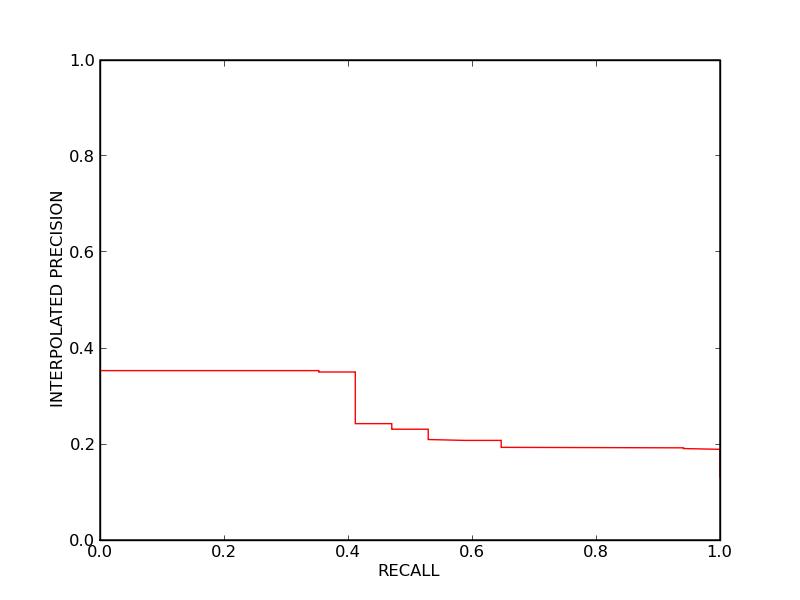
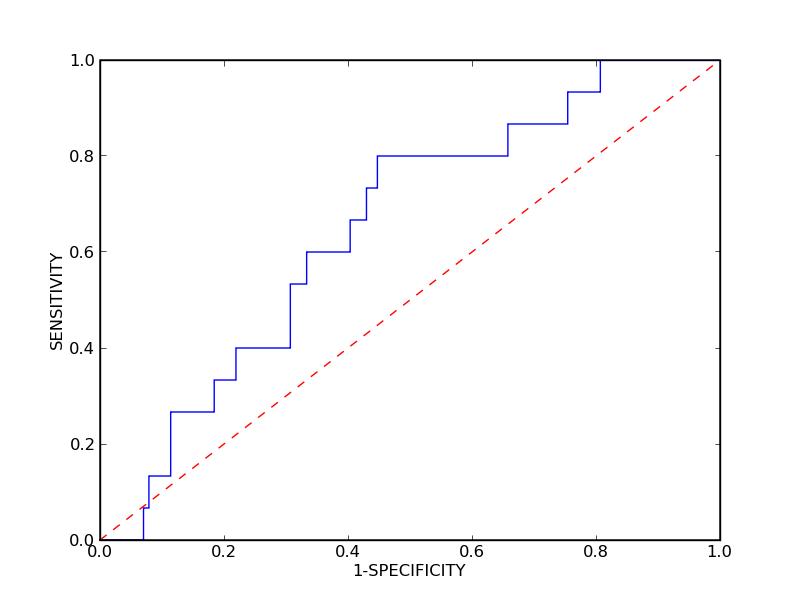
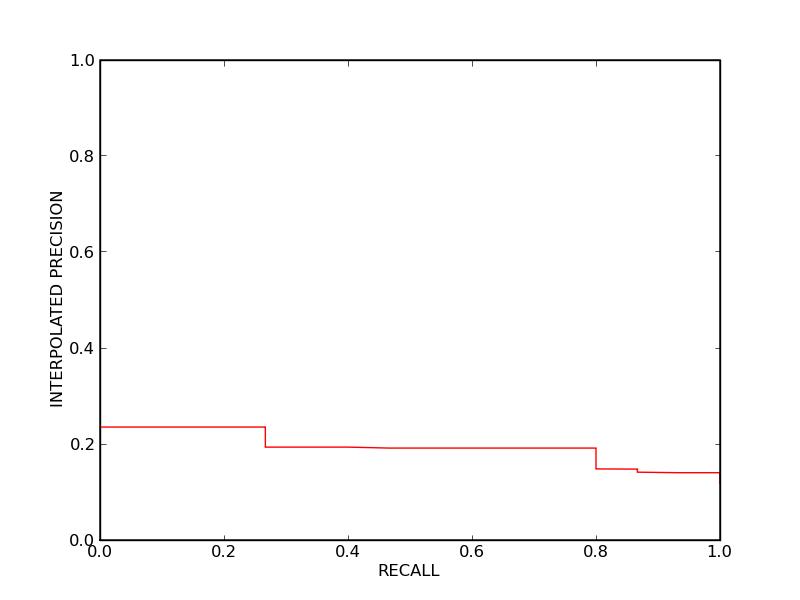
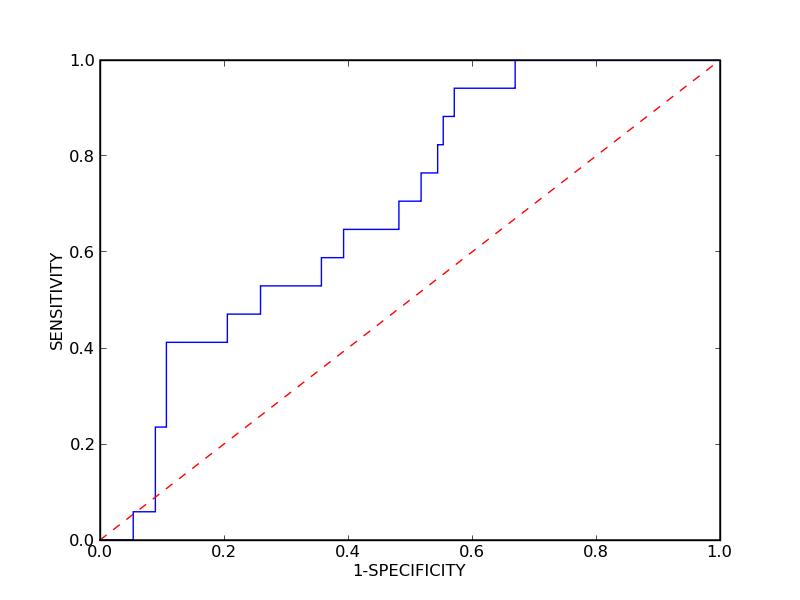
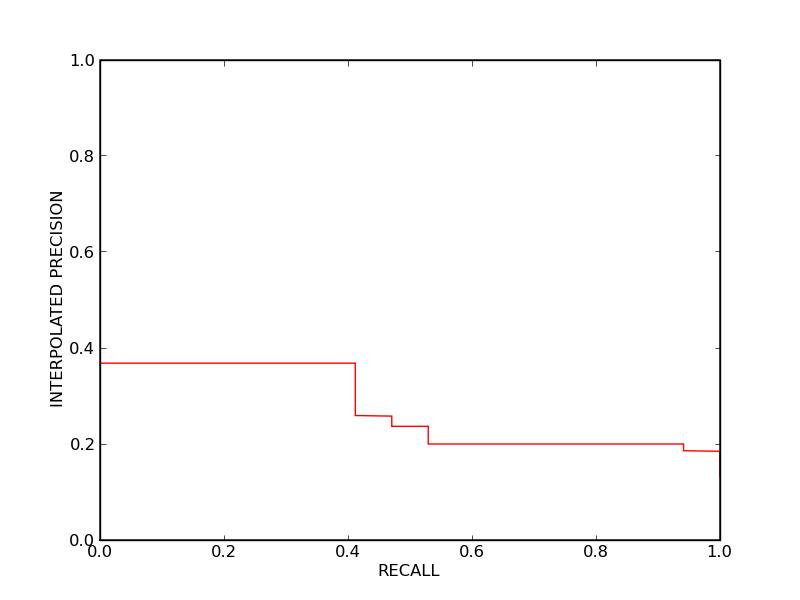
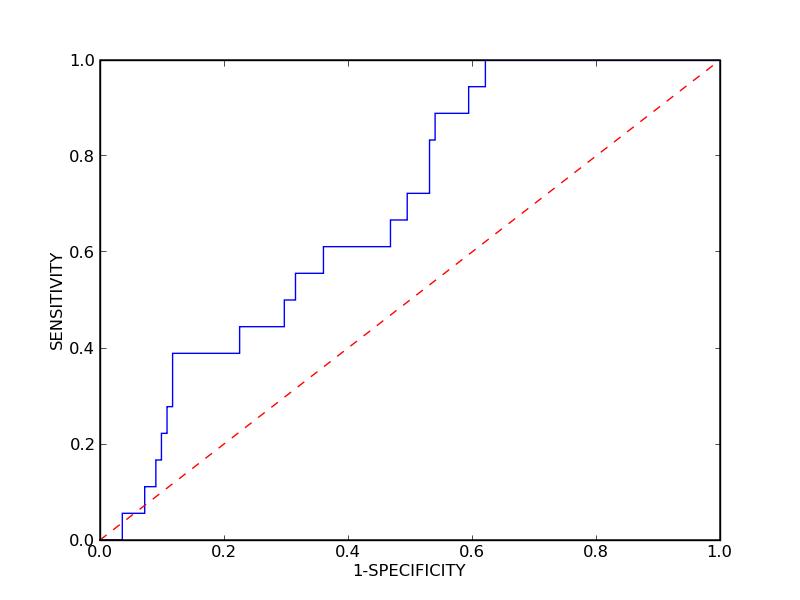
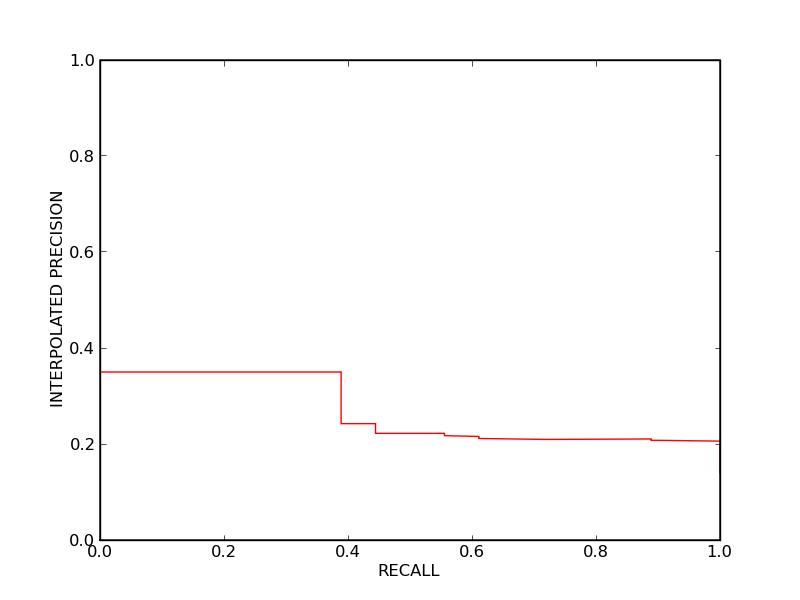
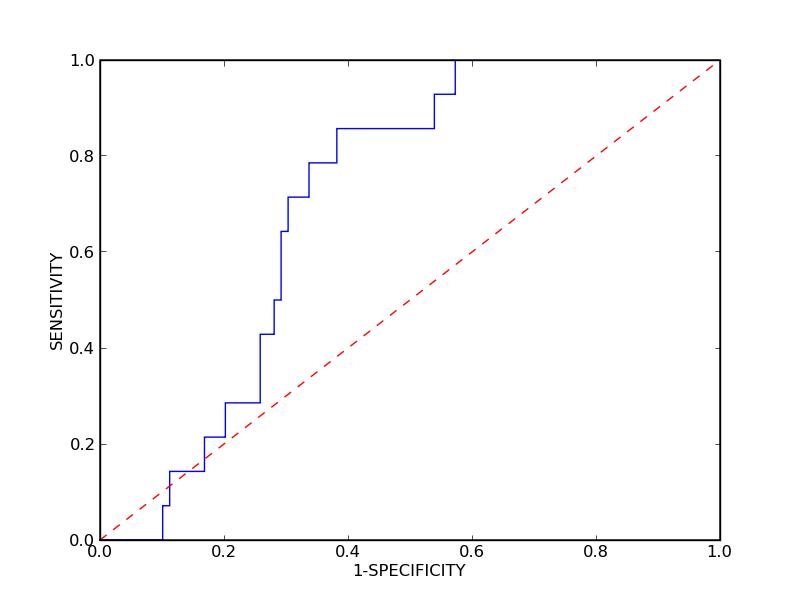
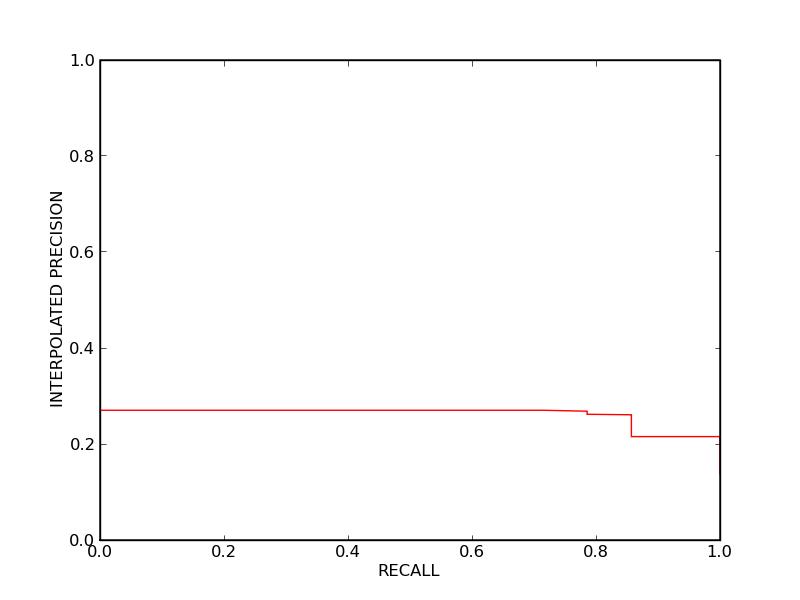
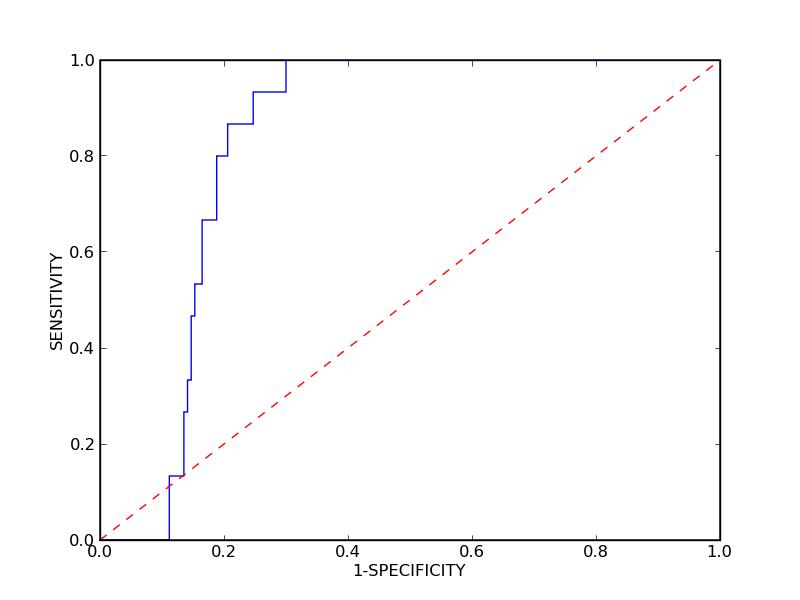
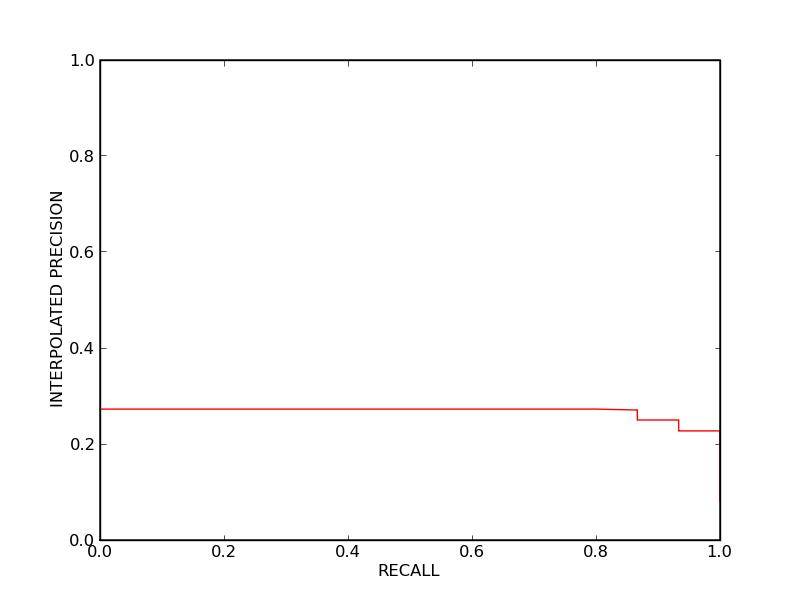
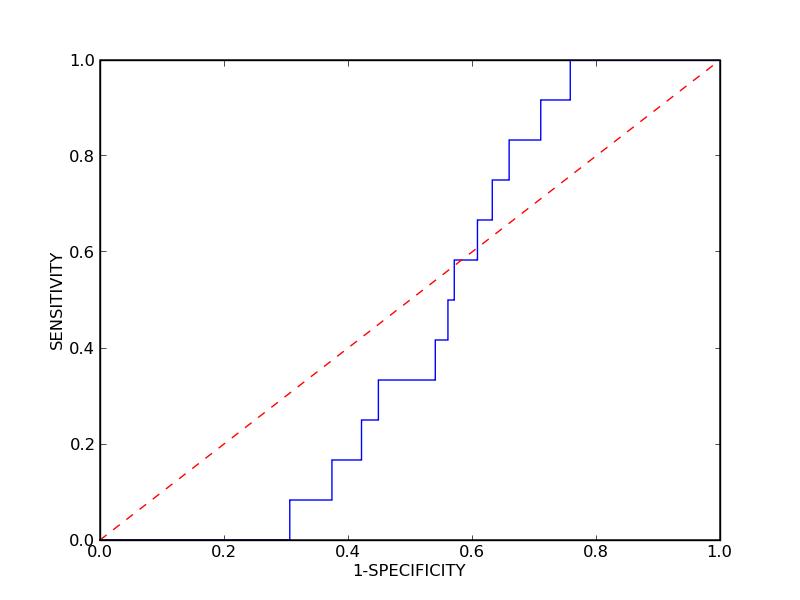
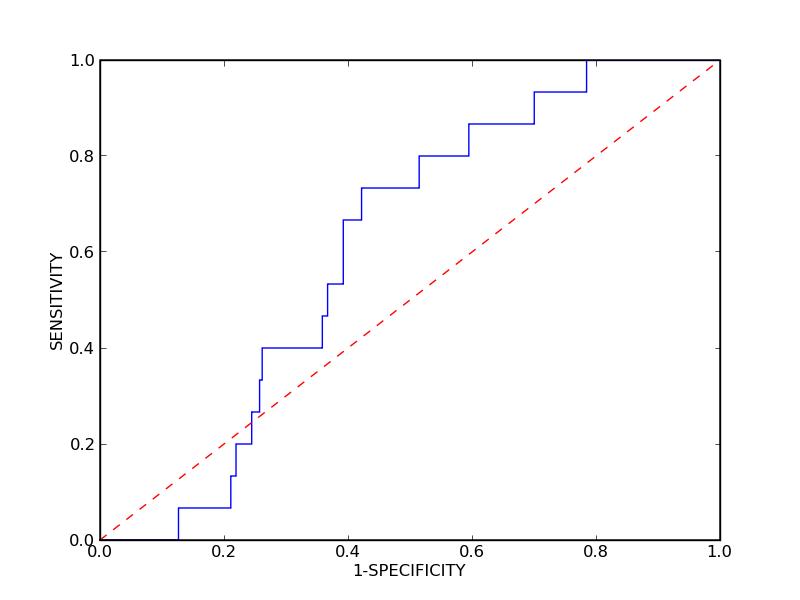
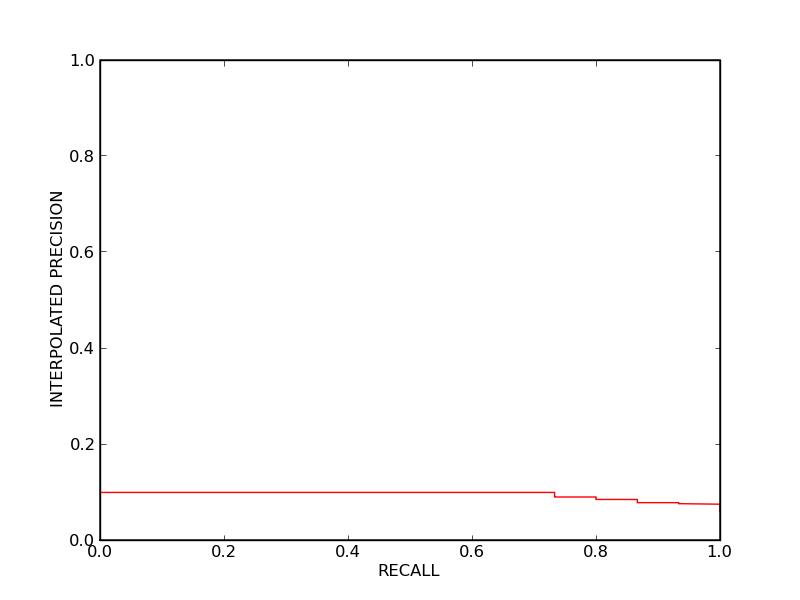
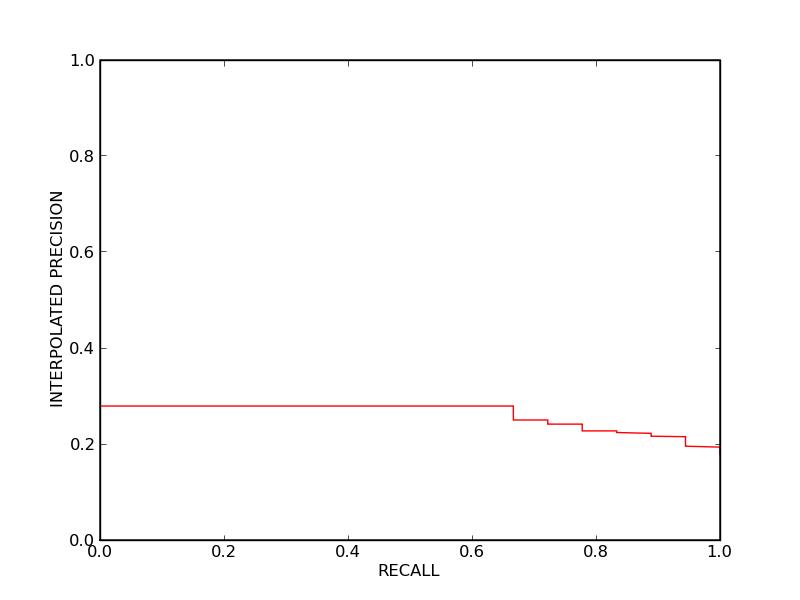
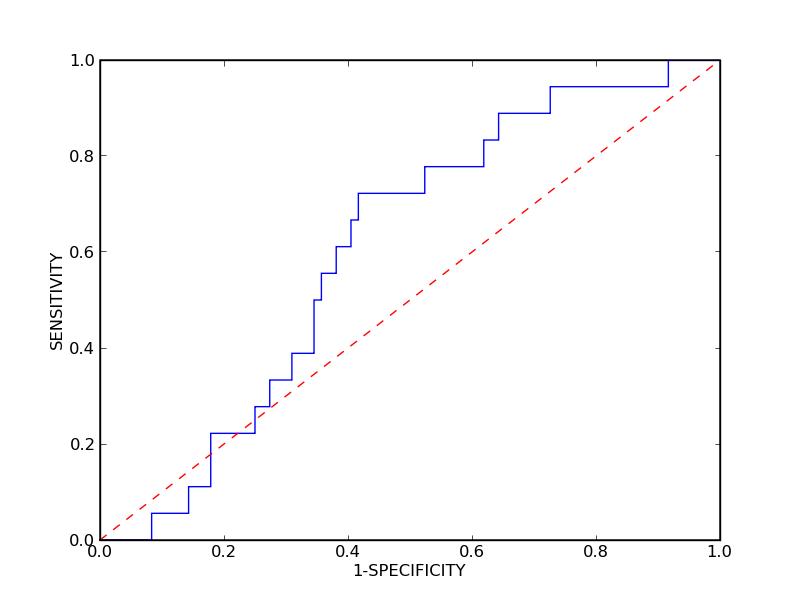
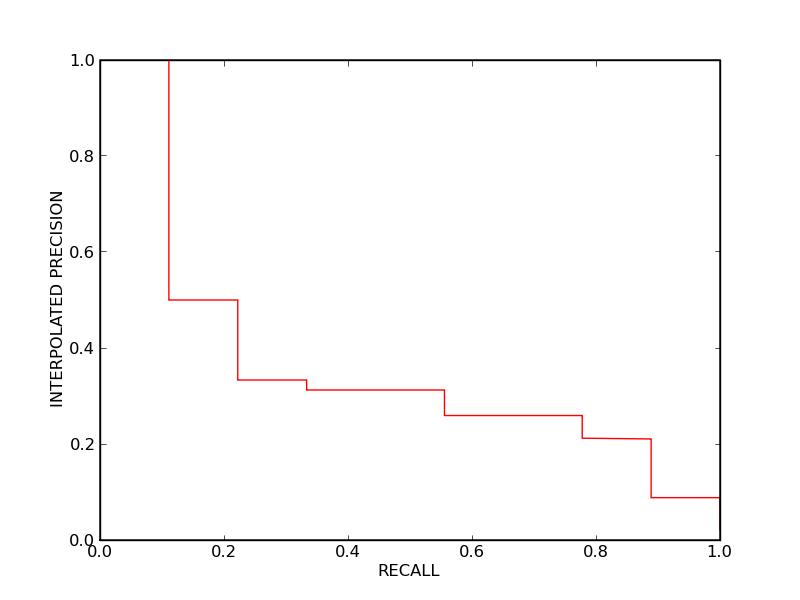
Protein Family IDs: 1g7lC 1n8zC 1g7jC 1nbzC 1bvkC 1bqlY 1kiqC 1melL 1ndgC 1mlcE 1ic4Y 1j1pY 1a2yC 1kipC 1g7iC 1j1oY 1g7mC 1dqjC 1fdlY 1yqvY 1c08C 1nbyC 1kirC 1dzbX 1ic5Y 1jhlA 1ic7Y 1j1xY 1ndmC 1g7hC
ROC Area Under the Curve (Family Average): 0.697837666667
Precision-Recall Equal Point (Family Average): 0.253200666667
Average Precision (Family Average): 0.24284
ROC Area Under the Curve (Family Average): 0.697837666667
Precision-Recall Equal Point (Family Average): 0.253200666667
Average Precision (Family Average): 0.24284
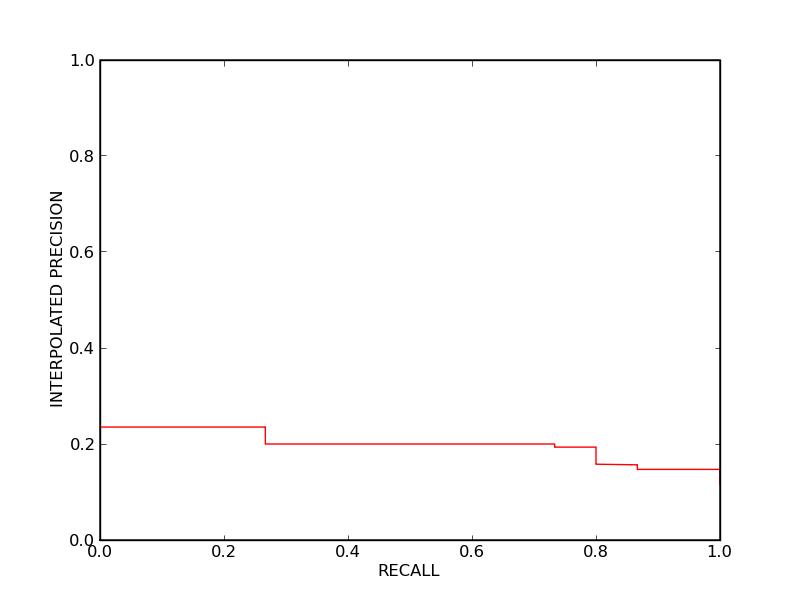
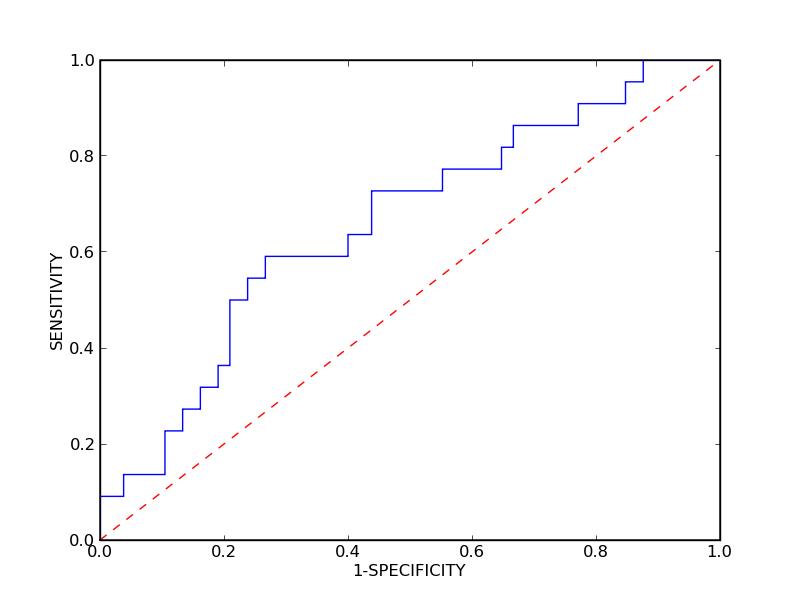
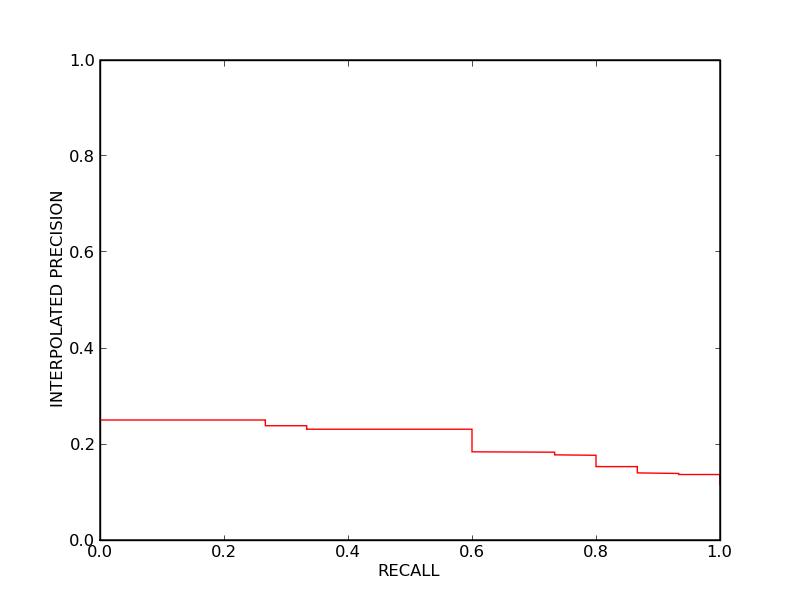
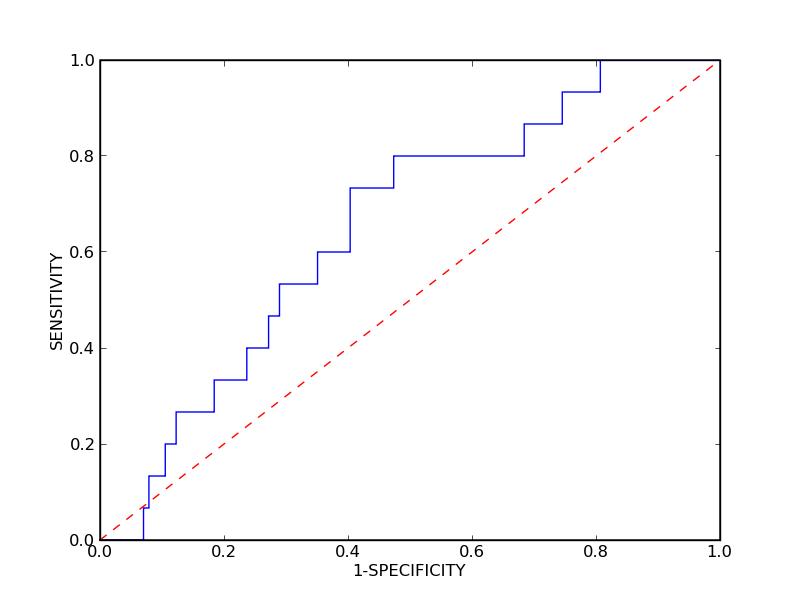

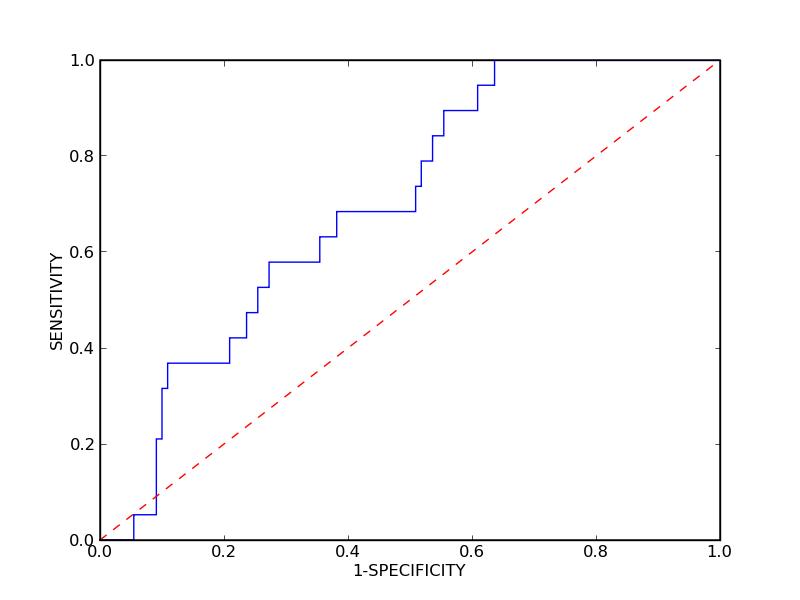
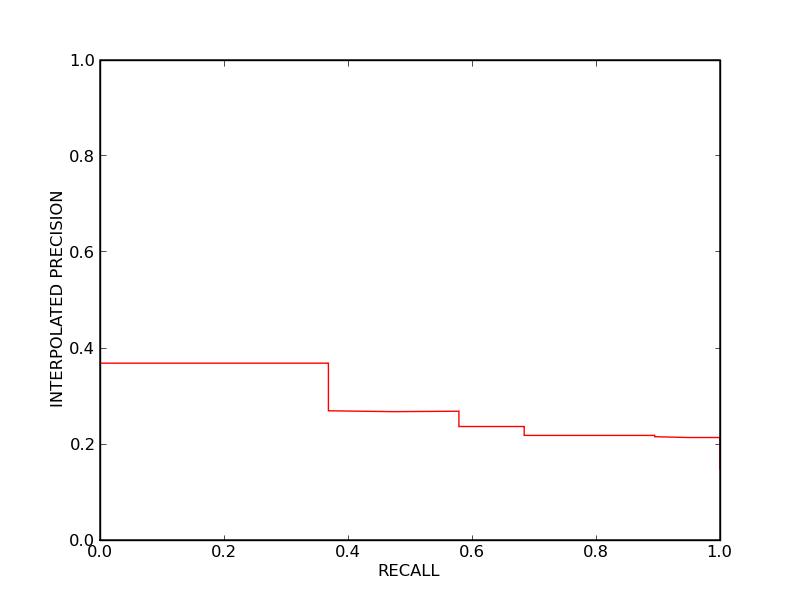
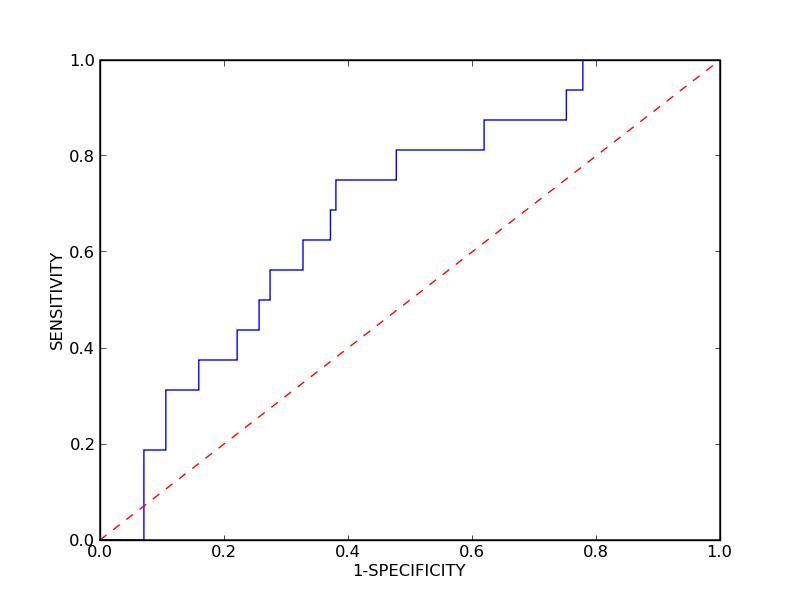
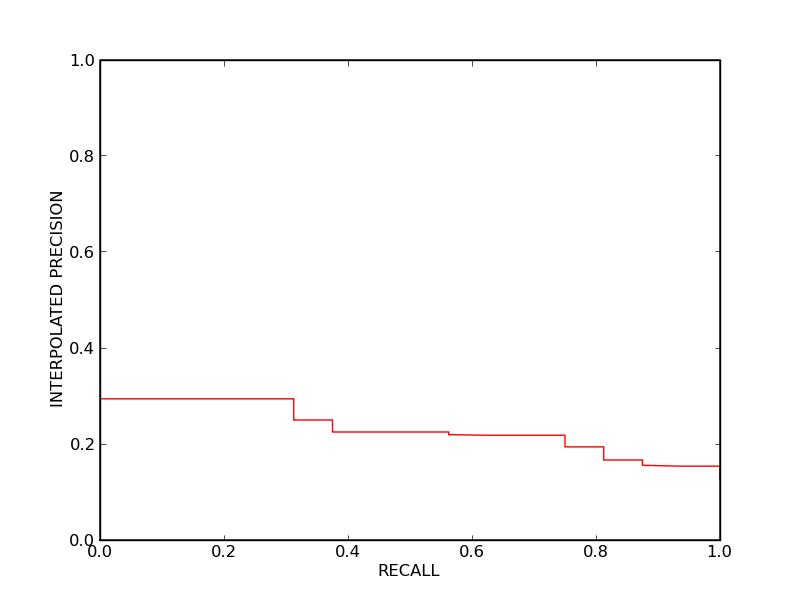
Protein Family IDs: 1k4cC 1k4dC
ROC Area Under the Curve (Family Average): 0.71507
Precision-Recall Equal Point (Family Average): 0.148355
Average Precision (Family Average): 0.20755
ROC Area Under the Curve (Family Average): 0.71507
Precision-Recall Equal Point (Family Average): 0.148355
Average Precision (Family Average): 0.20755
Protein Family IDs: 1lk3A
ROC Area Under the Curve (Family Average): 0.79896
Precision-Recall Equal Point (Family Average): 0.38889
Average Precision (Family Average): 0.31962
ROC Area Under the Curve (Family Average): 0.79896
Precision-Recall Equal Point (Family Average): 0.38889
Average Precision (Family Average): 0.31962
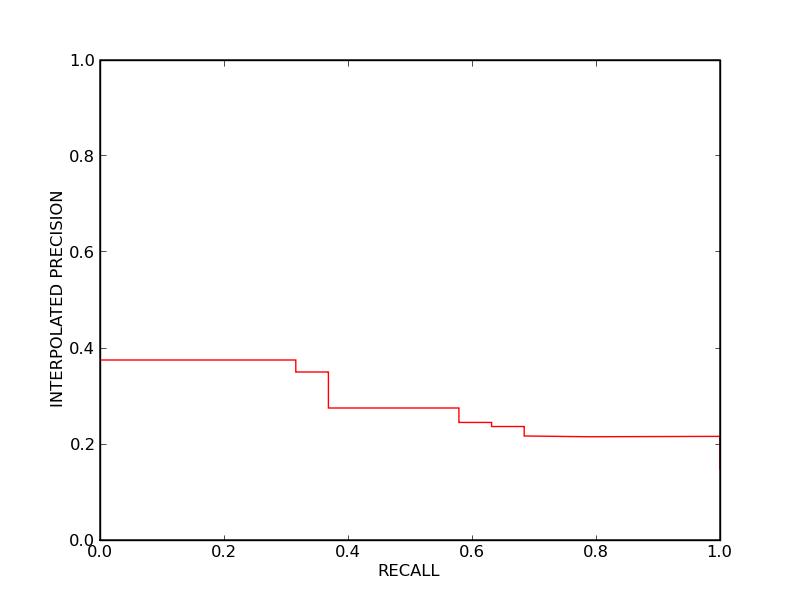
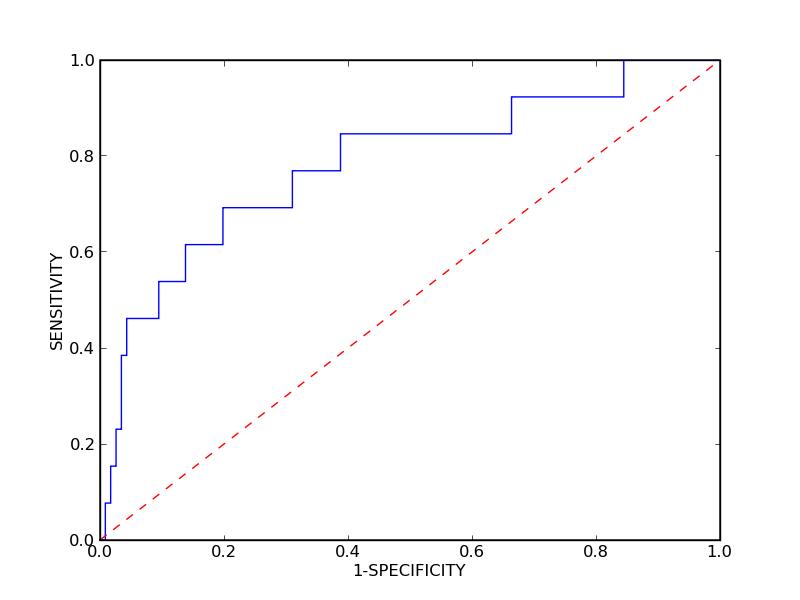
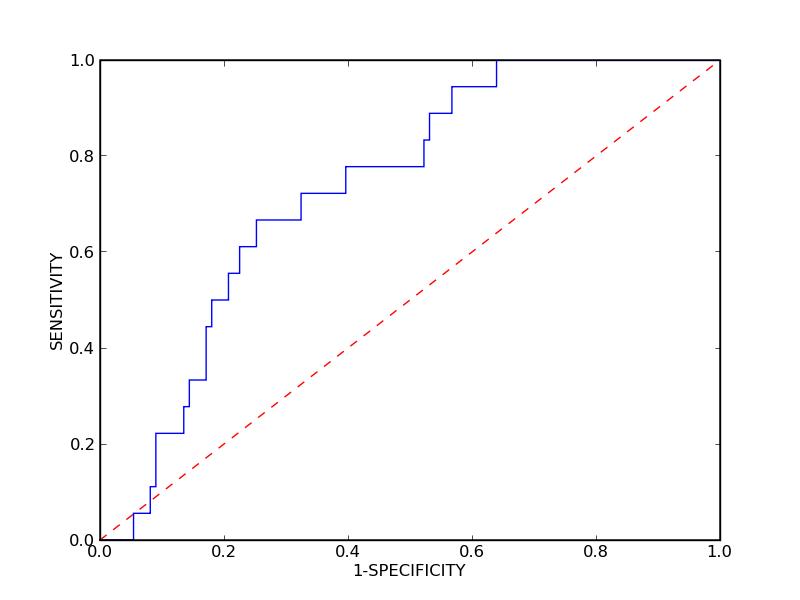
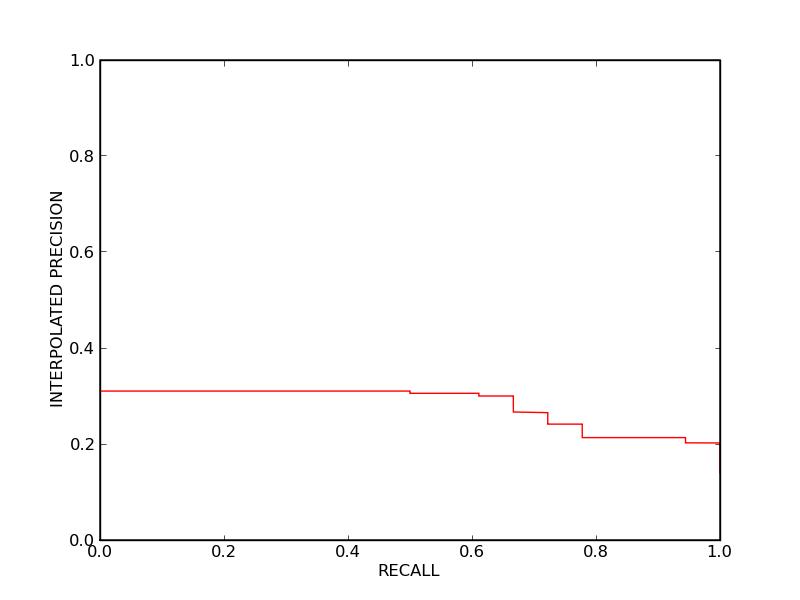
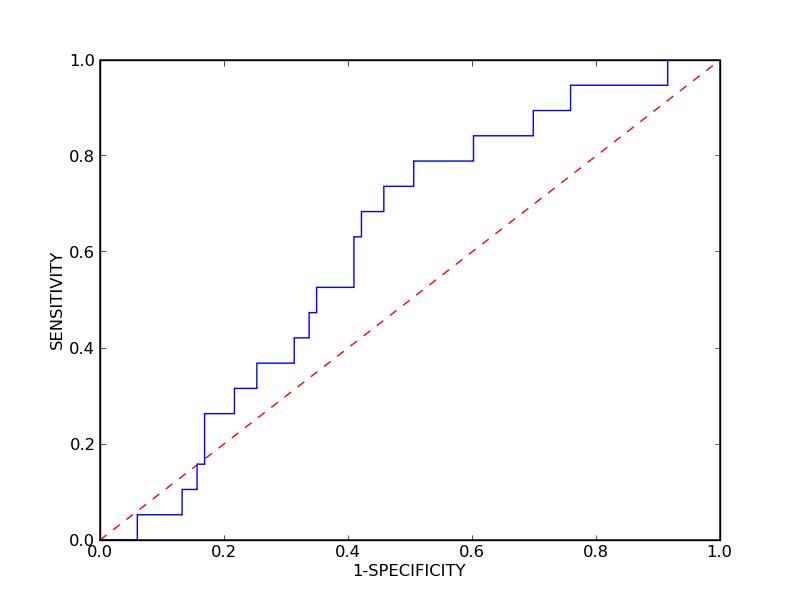
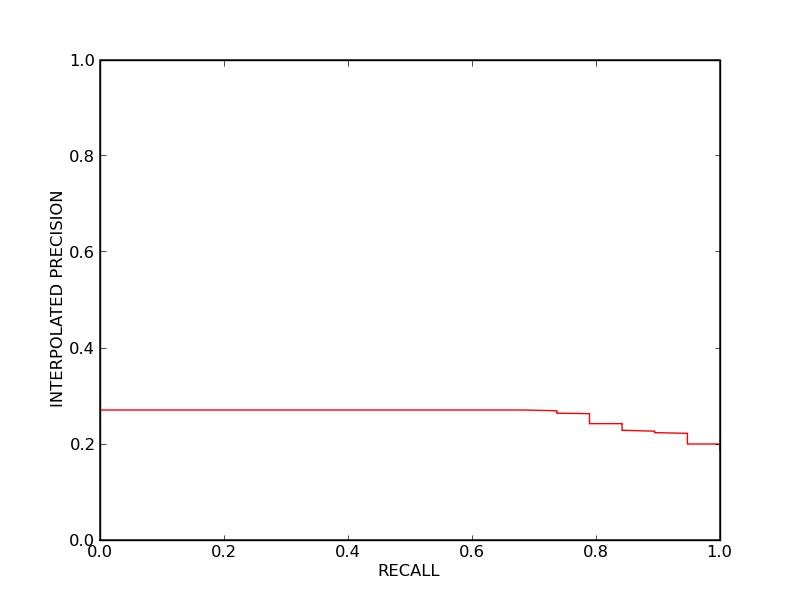
Protein Family IDs: 1a14N 1nmcN 1nccN 1ncdN 1ncaN 1ncbN
ROC Area Under the Curve (Family Average): 0.89646
Precision-Recall Equal Point (Family Average): 0.384908333333
Average Precision (Family Average): 0.385383333333
ROC Area Under the Curve (Family Average): 0.89646
Precision-Recall Equal Point (Family Average): 0.384908333333
Average Precision (Family Average): 0.385383333333
Protein Family IDs: 1h0dC
ROC Area Under the Curve (Family Average): 0.63361
Precision-Recall Equal Point (Family Average): 0.05882
Average Precision (Family Average): 0.18557
ROC Area Under the Curve (Family Average): 0.63361
Precision-Recall Equal Point (Family Average): 0.05882
Average Precision (Family Average): 0.18557
Protein Family IDs: 1iqdC
ROC Area Under the Curve (Family Average): 0.82009
Precision-Recall Equal Point (Family Average): 0.4375
Average Precision (Family Average): 0.34706
ROC Area Under the Curve (Family Average): 0.82009
Precision-Recall Equal Point (Family Average): 0.4375
Average Precision (Family Average): 0.34706
Protein Family IDs: 1ezvE 1kyoE
ROC Area Under the Curve (Family Average): 0.83161
Precision-Recall Equal Point (Family Average): 0.0
Average Precision (Family Average): 0.212255
ROC Area Under the Curve (Family Average): 0.83161
Precision-Recall Equal Point (Family Average): 0.0
Average Precision (Family Average): 0.212255
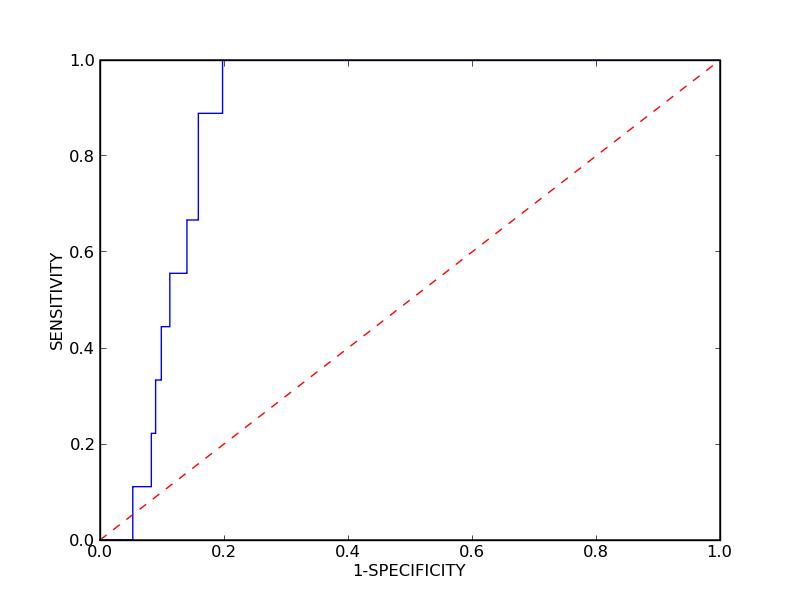
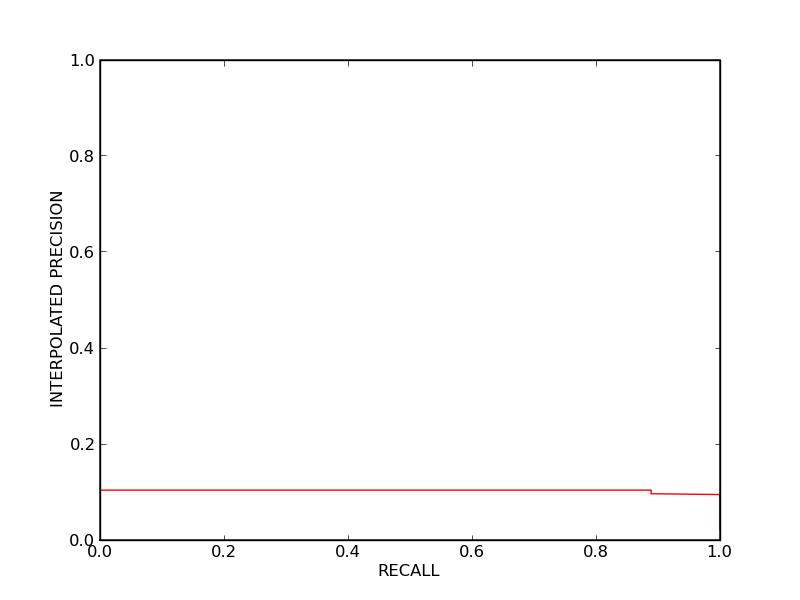
Protein Family IDs: 1otsA
ROC Area Under the Curve (Family Average): 0.87867
Precision-Recall Equal Point (Family Average): 0.0
Average Precision (Family Average): 0.08041
ROC Area Under the Curve (Family Average): 0.87867
Precision-Recall Equal Point (Family Average): 0.0
Average Precision (Family Average): 0.08041
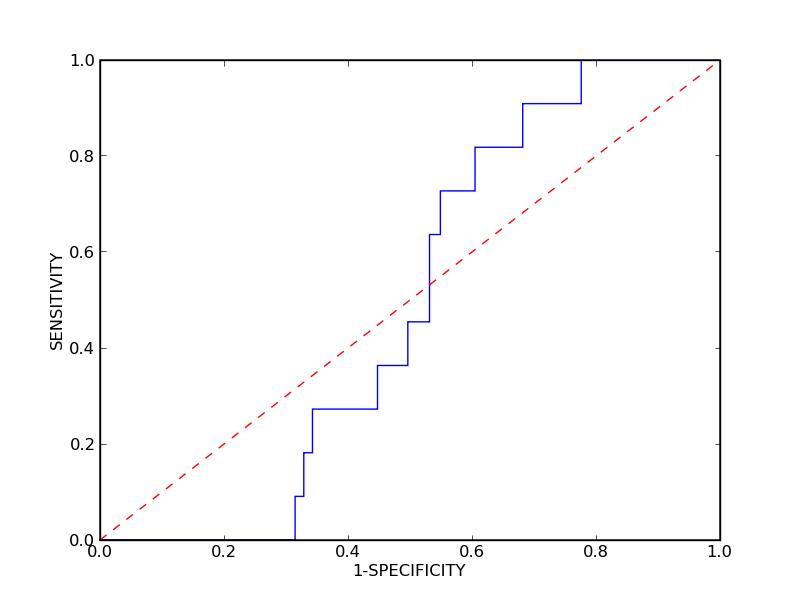
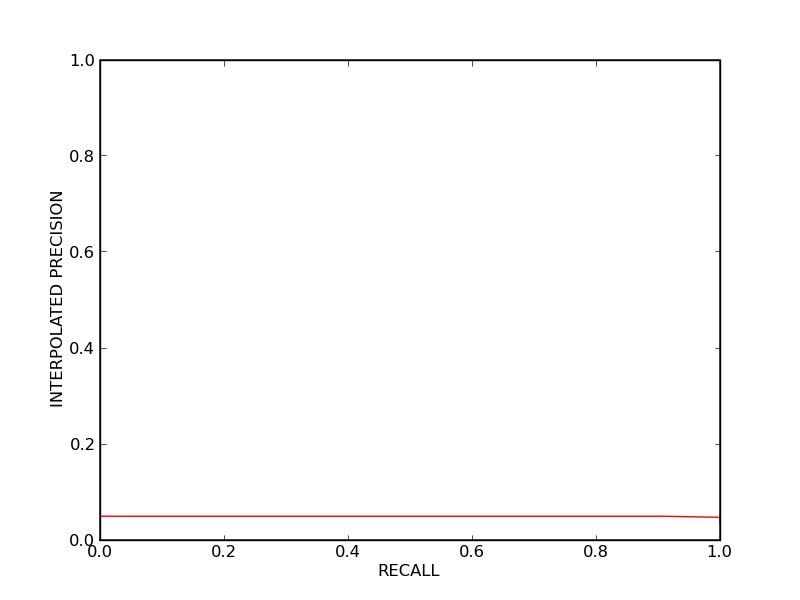
Protein Family IDs: 1g9mG 1rzkG 1g9nG 1rzjG 1gc1G
ROC Area Under the Curve (Family Average): 0.475842
Precision-Recall Equal Point (Family Average): 0.0
Average Precision (Family Average): 0.036432
ROC Area Under the Curve (Family Average): 0.475842
Precision-Recall Equal Point (Family Average): 0.0
Average Precision (Family Average): 0.036432


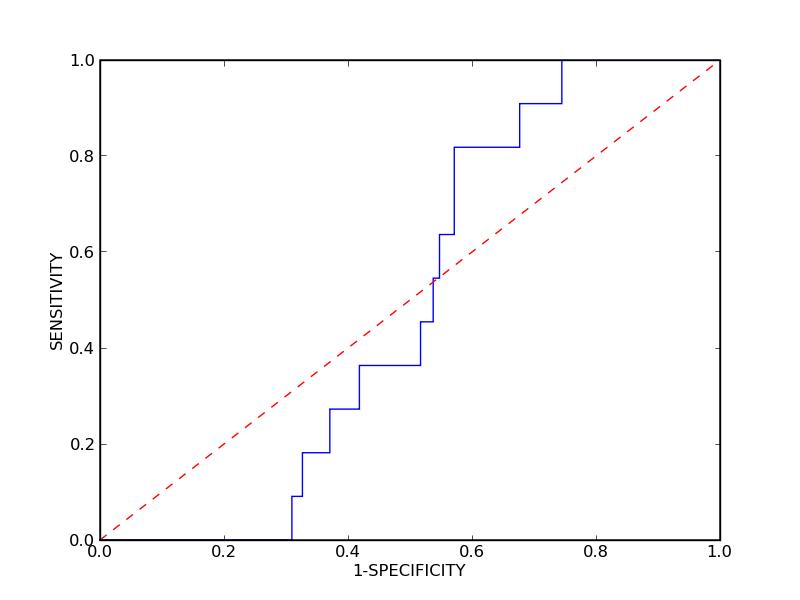
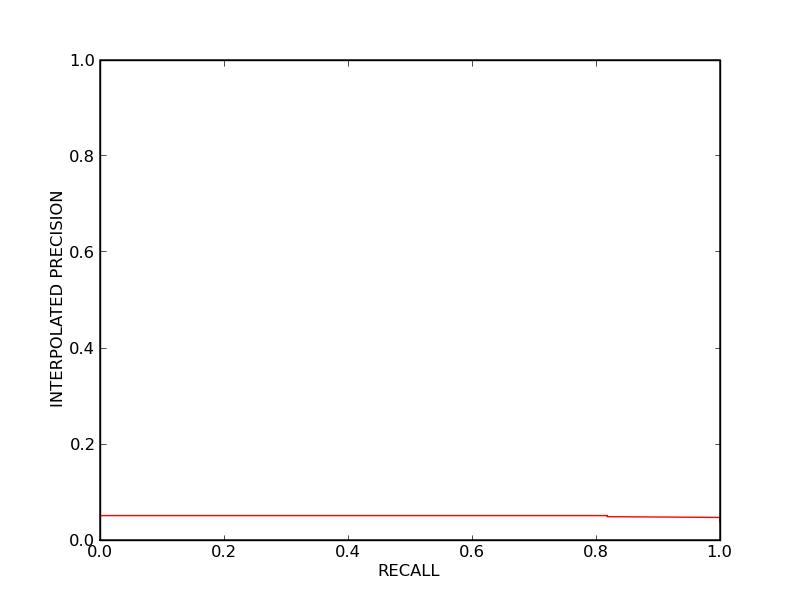
Protein Family IDs: 1ar1B
ROC Area Under the Curve (Family Average): 0.61013
Precision-Recall Equal Point (Family Average): 0.0
Average Precision (Family Average): 0.07499
ROC Area Under the Curve (Family Average): 0.61013
Precision-Recall Equal Point (Family Average): 0.0
Average Precision (Family Average): 0.07499
Protein Family IDs: 1tqcA 1tqbA 1tpxA
ROC Area Under the Curve (Family Average): 0.606723333333
Precision-Recall Equal Point (Family Average): 0.180313333333
Average Precision (Family Average): 0.21933
ROC Area Under the Curve (Family Average): 0.606723333333
Precision-Recall Equal Point (Family Average): 0.180313333333
Average Precision (Family Average): 0.21933

Protein Family IDs: 1oazA
ROC Area Under the Curve (Family Average): 0.62753
Precision-Recall Equal Point (Family Average): 0.1875
Average Precision (Family Average): 0.20982
ROC Area Under the Curve (Family Average): 0.62753
Precision-Recall Equal Point (Family Average): 0.1875
Average Precision (Family Average): 0.20982
Protein Family IDs: 1nfdB
ROC Area Under the Curve (Family Average): 0.95558
Precision-Recall Equal Point (Family Average): 0.75
Average Precision (Family Average): 0.82787
ROC Area Under the Curve (Family Average): 0.95558
Precision-Recall Equal Point (Family Average): 0.75
Average Precision (Family Average): 0.82787
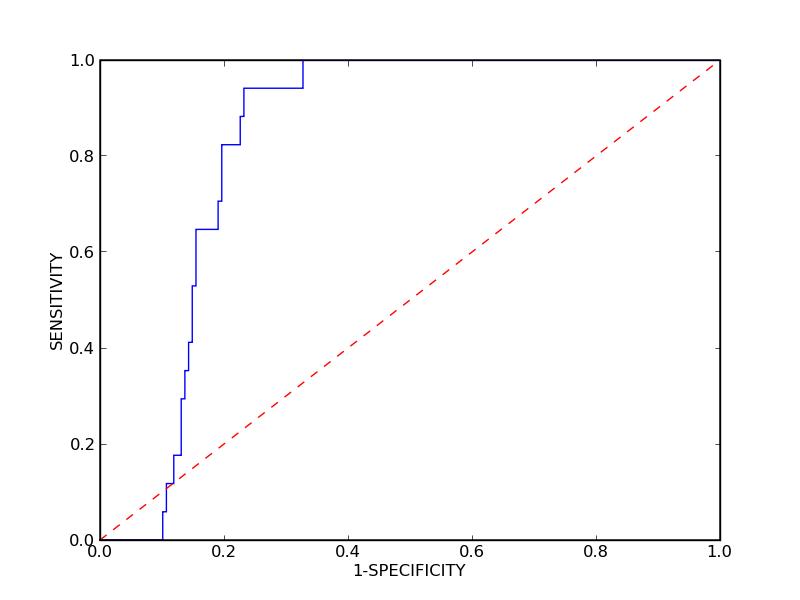
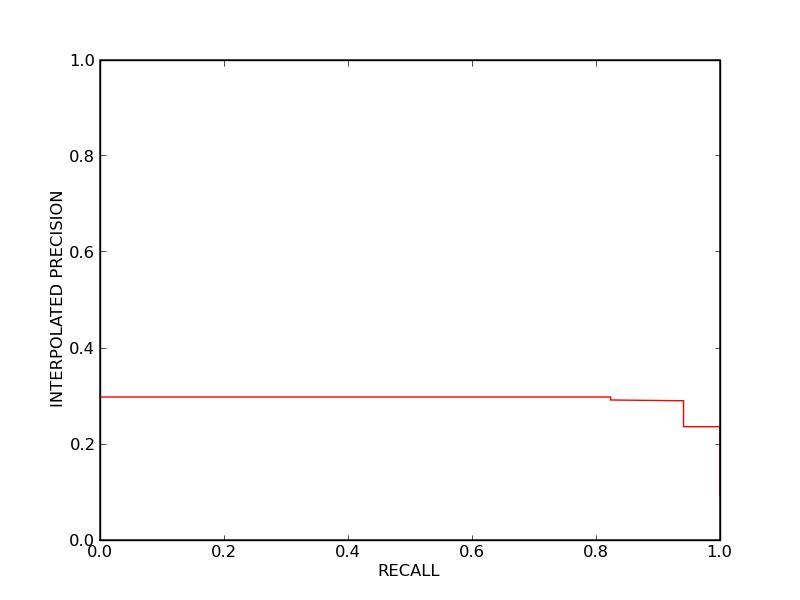
Protein Family IDs: 2hmiB
ROC Area Under the Curve (Family Average): 0.94933
Precision-Recall Equal Point (Family Average): 0.33333
Average Precision (Family Average): 0.35782
ROC Area Under the Curve (Family Average): 0.94933
Precision-Recall Equal Point (Family Average): 0.33333
Average Precision (Family Average): 0.35782
Protein Family IDs: 1eo8A 1qfuA
ROC Area Under the Curve (Family Average): 0.30579
Precision-Recall Equal Point (Family Average): 0.025
Average Precision (Family Average): 0.042215
ROC Area Under the Curve (Family Average): 0.30579
Precision-Recall Equal Point (Family Average): 0.025
Average Precision (Family Average): 0.042215

Protein Family IDs: 1fskA
ROC Area Under the Curve (Family Average): 0.88277
Precision-Recall Equal Point (Family Average): 0.35294
Average Precision (Family Average): 0.36645
ROC Area Under the Curve (Family Average): 0.88277
Precision-Recall Equal Point (Family Average): 0.35294
Average Precision (Family Average): 0.36645
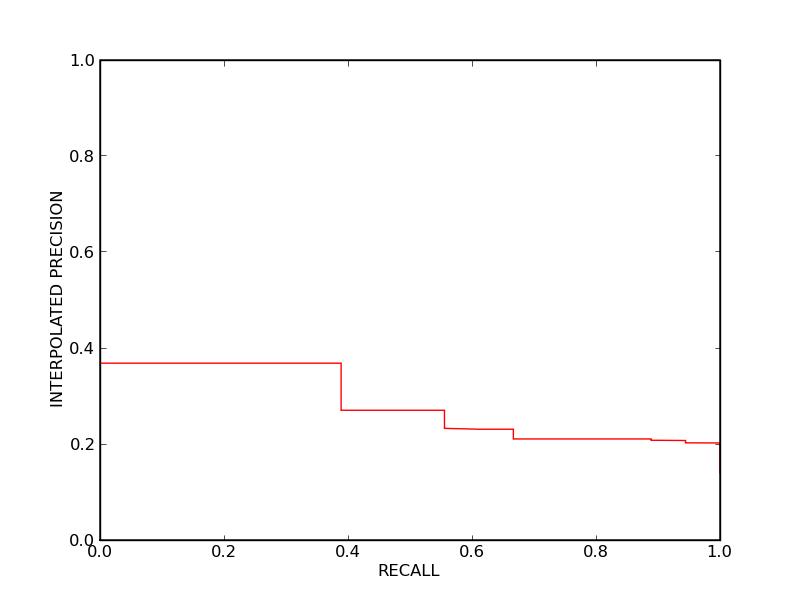
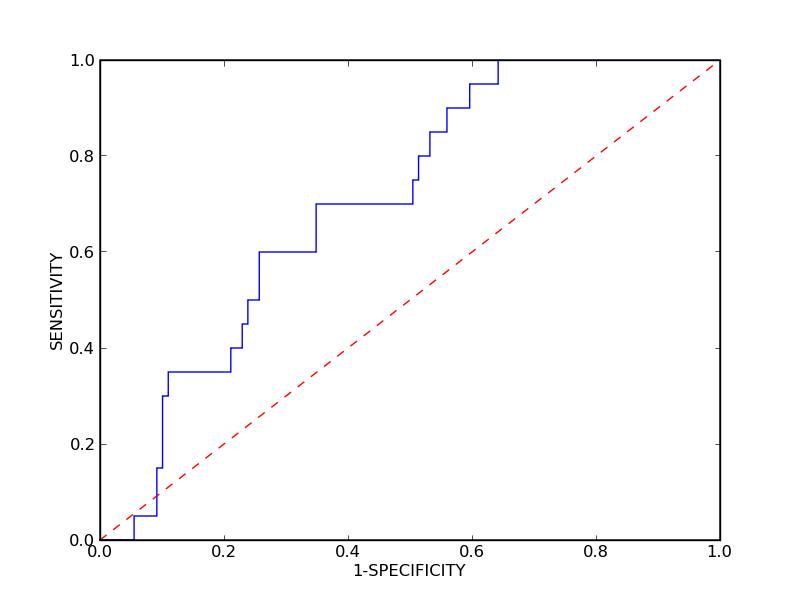
Protein Family IDs: 1egjA
ROC Area Under the Curve (Family Average): 0.87547
Precision-Recall Equal Point (Family Average): 0.58333
Average Precision (Family Average): 0.62964
ROC Area Under the Curve (Family Average): 0.87547
Precision-Recall Equal Point (Family Average): 0.58333
Average Precision (Family Average): 0.62964
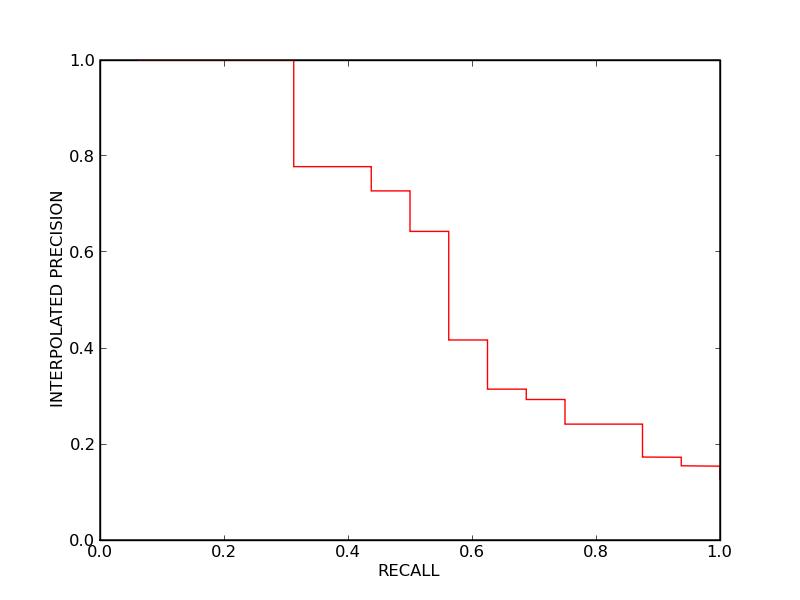
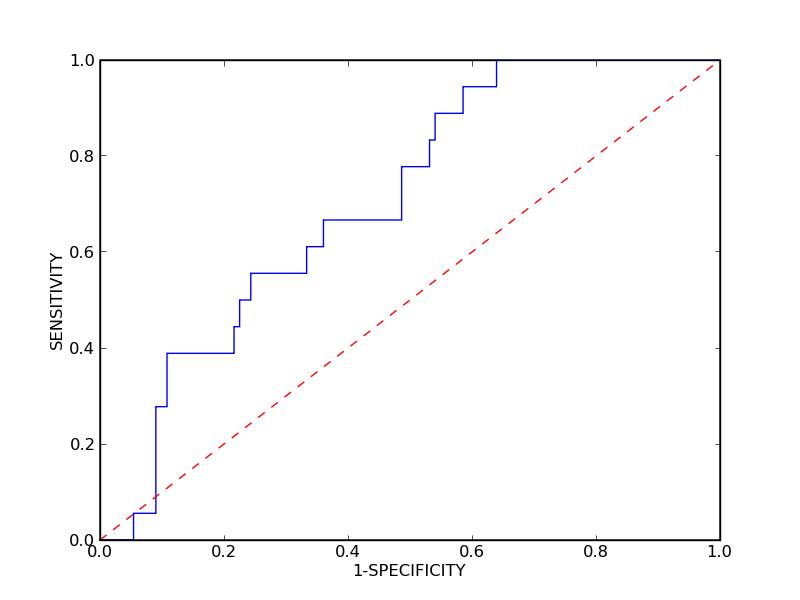
Protein Family IDs: 1ty6A
ROC Area Under the Curve (Family Average): 0.86155
Precision-Recall Equal Point (Family Average): 0.15789
Average Precision (Family Average): 0.1548
ROC Area Under the Curve (Family Average): 0.86155
Precision-Recall Equal Point (Family Average): 0.15789
Average Precision (Family Average): 0.1548